Returns Forecasting in Cross-Border E-commerce

- Cross-border retailers need strong returns forecasting to predict return rates, refund timing, and inventory needs in each country.
- Higher return costs in international returns come from shipping costs, duty handling, and longer return windows.
- Better returns forecasting improves online shoppers’ expectations by making refund timing more predictable.
- ReverseLogix strengthens cross-border forecasting with a dashboard that manages return labels, transit events, and routing for each country.
On average, the cost of cross-border returns is exponentially higher than local or national-level returns because each is tied to higher shipping costs, duty treatment, and long transit windows that strain forecasting models built for local operations. However, retailers and e-commerce platforms gain more control over these returns by building or leveraging returns forecasting models that align with actual demand for international returns.
In this article, we will explore how returns forecasting shapes real value for e-commerce platforms that sell across borders.
Global Returns Move Faster Than Retailers Expect
Although it is common for online retailers to assume that the cost of cross-border returns increases linearly, the reality is that each layer of global movement introduces new factors that distort return rates and delay refunds. This is why returns forecasting becomes vital once items cross borders. The cost of each mistake increases with distance, transit time, and duty handling.
The World Customs Organization once noted that “cross-border packages move through more steps than most shippers realize,” which helps explain why retailers face unpredictable challenges in the reverse supply chain process. When returns cross borders, factors such as customs requirements, duty or tariff charges, and routing rules often slow refunds and weaken customer expectations.
A retailer that offers free returns in-store cannot assume the same experience will hold for international returns, where customer expectations shift due to shipping costs and long return windows. However, retailers involved in cross-border transactions tend to have more control when they treat global return data as a different market rather than a copy of the domestic demand.
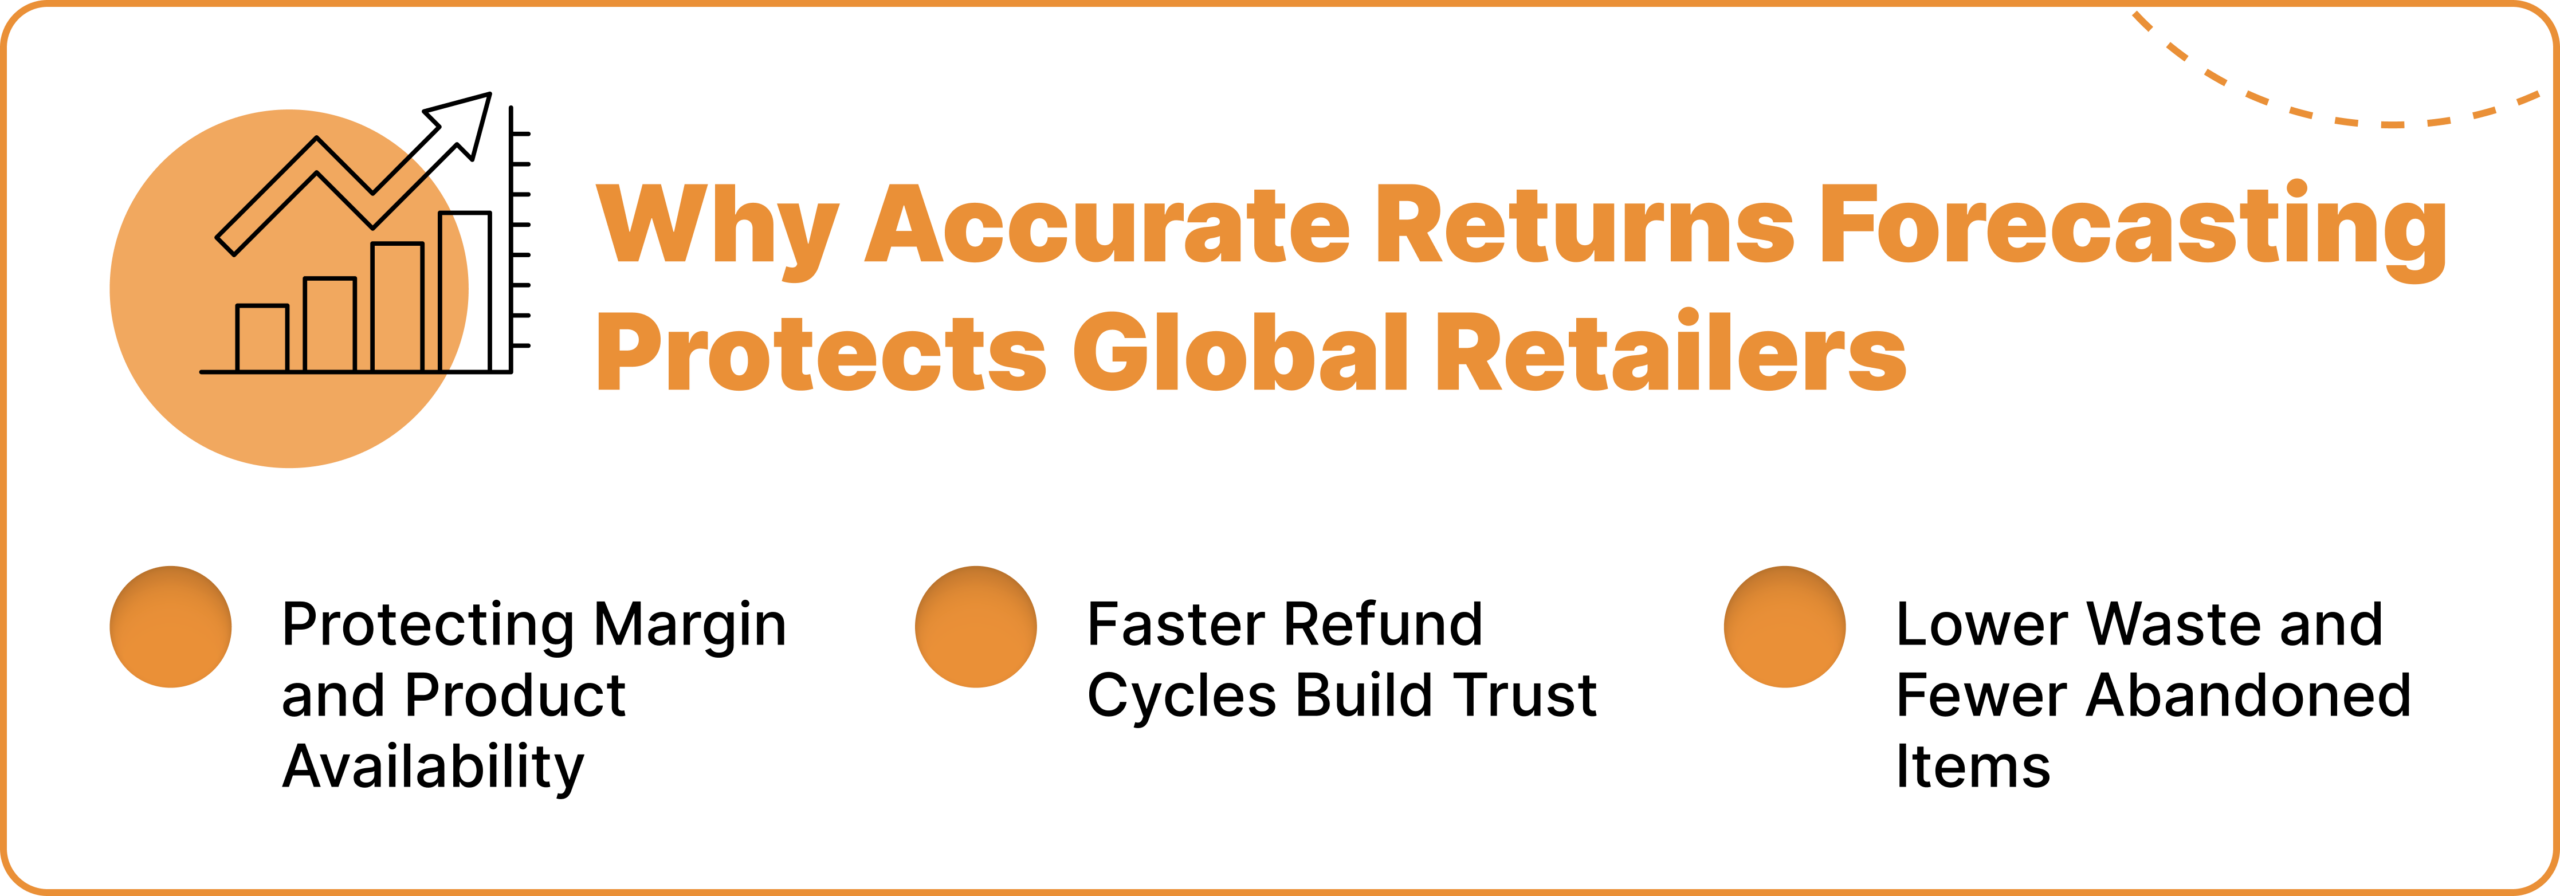
Why Accurate Returns Forecasting Protects Global Retailers
Managing international returns comes with its fair share of challenges, but it is more manageable when you invest in improving forecasting accuracy, as each misstep triggers higher costs on the return line.
1. Protecting Margin and Product Availability
A weak forecast ties up inventory across borders, which in turn hurts retail sales in each region. When return rates rise in a particular product category without warning, the store may lose stock in one country while facing excess in another. This hurts the supply chain because the retailer cannot move products fast enough to meet demand in one area while clearing backlogs in another. It is a lose-lose situation.
2. Faster Refund Cycles Build Trust
Global shoppers want clear return labels, quick refunds, and accurate return instructions. And when shoppers return items, delays caused by long transit or customs reviews can lead to a bad experience. But having a strong returns forecasting model improves the refund timeline by enabling the retailer to anticipate slow lanes. When you can predict choke points early, the refund cycle improves, which plays a critical role in ensuring customer loyalty in global markets.
3. Lower Waste and Fewer Abandoned Items
Bad forecasts lead to abandoned returns if it becomes too expensive to move the items across borders. These items can risk losing their resale value, which is also a double loss. With accurate forecasting, routes remain efficient, reducing waste in global operations.
What Goes into a Strong Forecast in Global E-commerce
A global business gains better control when it builds returns forecasting models that reflect cross-border reality. This section explains the building blocks.
1. SKU-Level Predictive Patterns
Forecasting improves when retailers study return rates at the SKU level for each country. Apparel, electronics, footwear, and beauty products exhibit different return patterns across cultures, shipping, and purchase habits. When retailers track return data by region, they build stronger predictions for product pages and product descriptions, which helps reduce return rates.
2. Event Tracking Across the Return Lane
International returns pass through many events: returns initiation, in transit, customs review, entry cleared, and item received. A clear view of these steps sharpens the forecast, which means that if, for example, parcels slow down at customs, you can adjust predictions for refund timing and warehouse work.
3. Duty and Tax Pattern Modeling
Retailers must predict how many returns fall into duty-paid or duty-unpaid groups in each country. Duty refunds shift by region, which changes return costs. Strong forecasting models include duty scenarios tied to each return lane.
4. Carrier Performance History
Global carriers vary by lane, season, and origin. Past delays reveal trends that shape future predictions. When a retailer sees delays in a lane during winter, that pattern becomes part of the forecast for that return window.
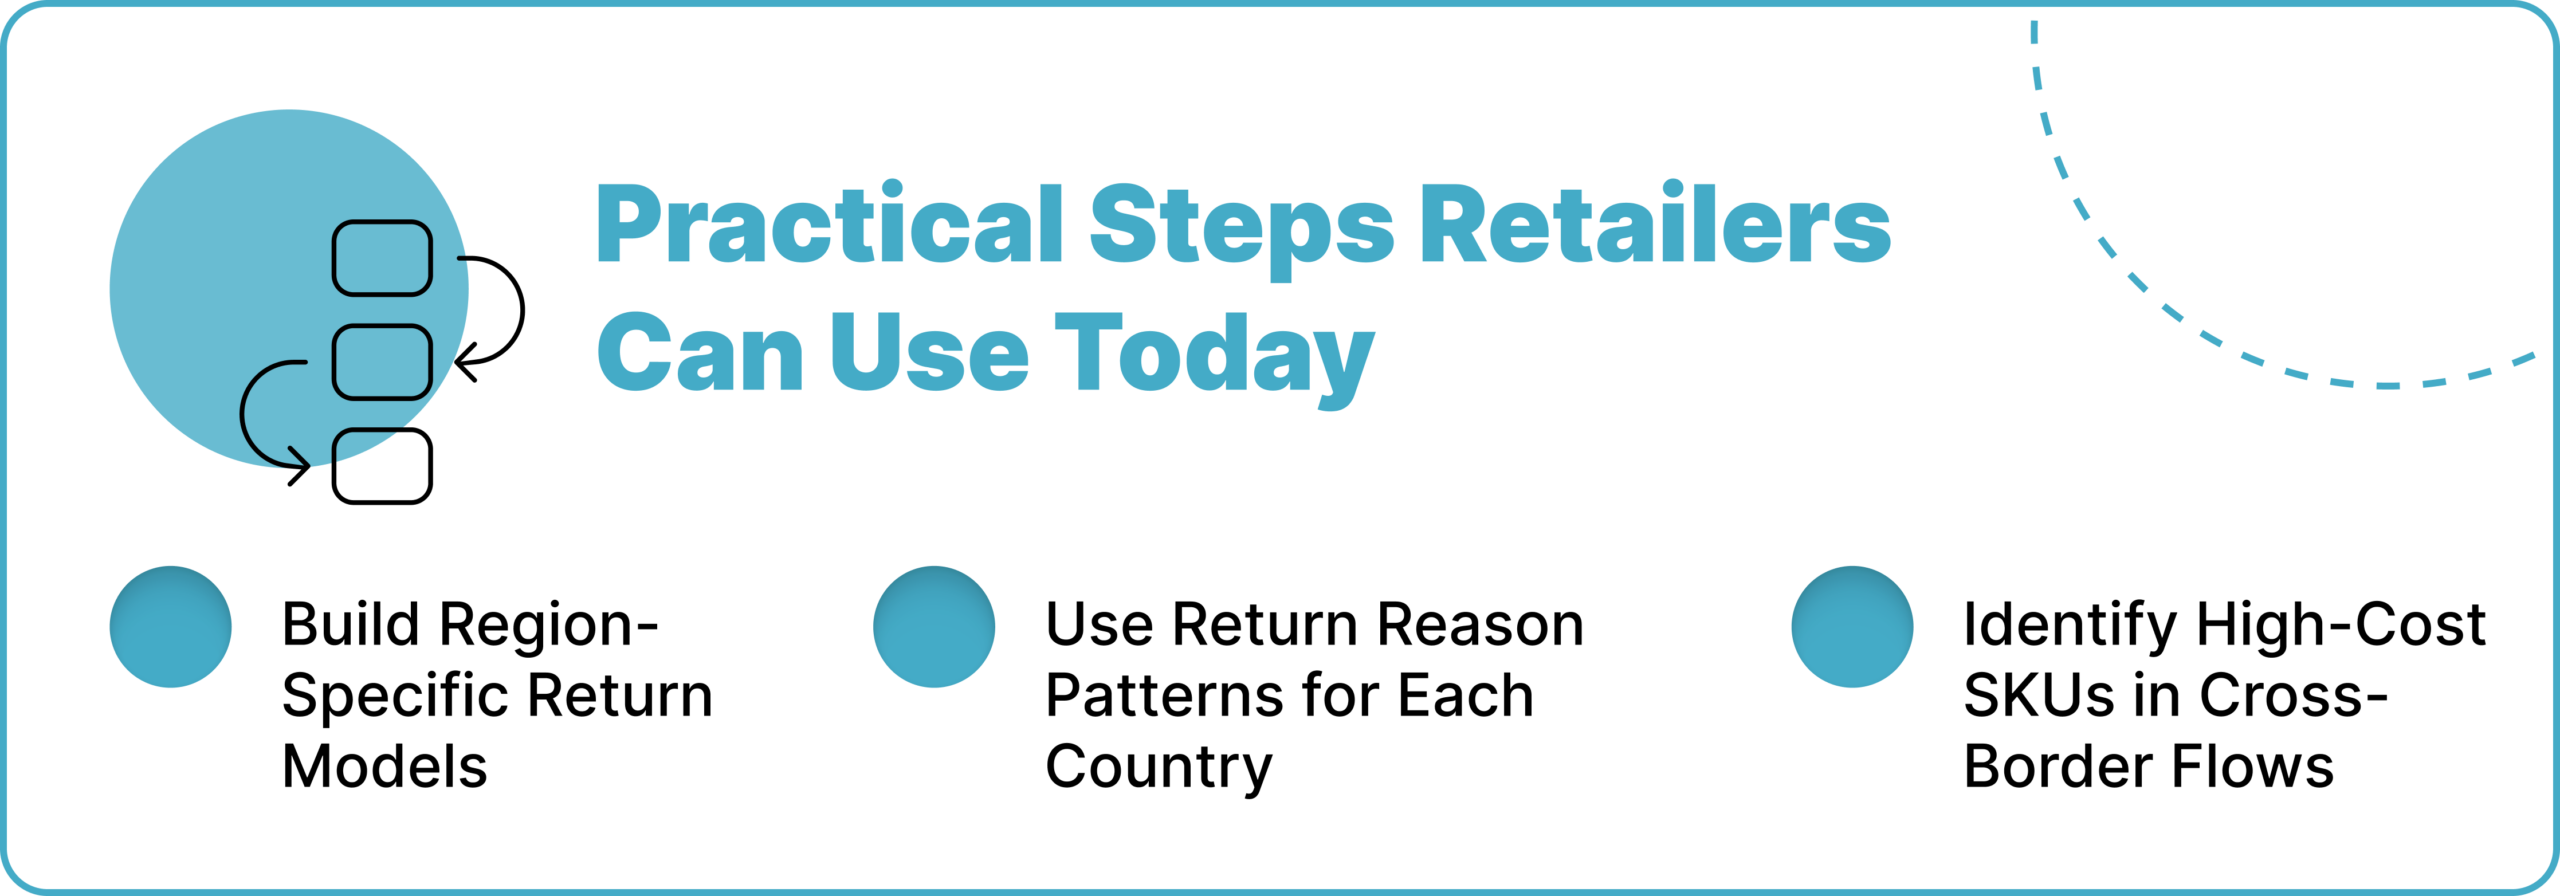
Practical Steps Retailers Can Use Today
Retailers can start improving their global forecasting with simple steps that reveal major trends.
1. Build Region-Specific Return Models
Avoid aggregating global online returns into a single database. Each country needs its own model with its own return rates. When a business sees that returns from Canada move faster than those from Europe, the forecast becomes more accurate. Region-specific forecasting helps your e-commerce business reduce avoidable waste, manage product category demand, and plan for in-store returns where available.
2. Use Return Reason Patterns for Each Country
Return reasons reveal gaps in product descriptions, fit charts, or shipping expectations. For example, if you know that your customers in Europe return items for poor fit but those in the Middle East return them for damaged packaging, your system can make better forecasts. Knowing these patterns also reduces return rates by giving you a chance to make necessary adjustments to mitigate them, leading to greater predictability.
3. Identify High-Cost SKUs in Cross-Border Flows
Heavy or fragile items cost more to return in global lanes due to shipping and duty fees. When you flag these SKUs, you must be extra cautious when making returns forecasts, as the cost spike significantly affects the forecast.
How ReverseLogix Supports Cross-Border Returns Forecasting
ReverseLogix is built with meaningful metrics and game-changing insights in every module. With end-to-end returns management and best-in-breed tracking and analytics, ReverseLogix unifies all your existing business technologies and delivers metrics and data to every team member. With our platform, you have total visibility into the entire cross-order returns journey, helping you optimize performance, stay competitive, and gain a real-time edge.
Operationalize all your data so it’s usable and understandable. Access customized reporting by department, user role, or location to ensure distributed teams stay in sync. Put ReverseLogix in your hands and unlock more value from every return. The system improves global forecasting by linking return data, shipping, duties, and warehouse work into a single dashboard, giving you more control when predicting returns across countries that move at different speeds.
Frequently Asked Questions
Return costs rise because global shipping, duty treatment, and customs requirements add layers that domestic sellers never face. These layers widen the gap between expected return rates and real-life return activity.
Forecasting helps retailers predict when customers return items, how long the return process will take, and how return windows shift demand. This strengthens planning for product availability and online sales in each market.
SKU-level return rates, return reasons, product category trends, return labels, transit delays, and duty-related events help retailers understand why customers return items and how those patterns shape return rates.
Duties determine how much of the refund the seller can recover. Some countries allow refunds of duties, while others do not. This changes the accounting line for each international return and influences returns forecasting.
Return rates shift due to product descriptions, buyer habits, shipping costs, country rules, and customer expectations. For example, apparel returns remain high in parts of North America because buyers order multiple sizes before choosing one.