Why Your Returns Management Is Costing More Than You Think (And How to Fix It)

Most retailers and manufacturers account for the cost of returns the same way they account for any other expense. The product is returned, the refund is issued, and the difference is recorded as a loss in the books. But the thing is that math is incorrect because refunds are actually the cheapest part of the returns management process.
Article Brief:
To get the true cost of returns, you have to factor in labor, transportation, depreciation, and disposition.
Return fees, processing costs, and lost revenue due to damaged goods are often separated into different budgets, making it difficult for leadership teams to see their combined impact on profit margins.
Fixing the problem requires reengineering the process and implementing a returns management system that connects every step to standardized disposition rules.
The real cost of returns is lurking in places finance teams rarely examine, which is why so many otherwise well-run retailers and manufacturers continue hemorrhaging margin every time a customer ships something back.
If you look beyond the refunds, you will discover that the average return can cost two or even three times the value of the refund itself. This article walks through where that money actually goes — and what businesses can do to regain control.
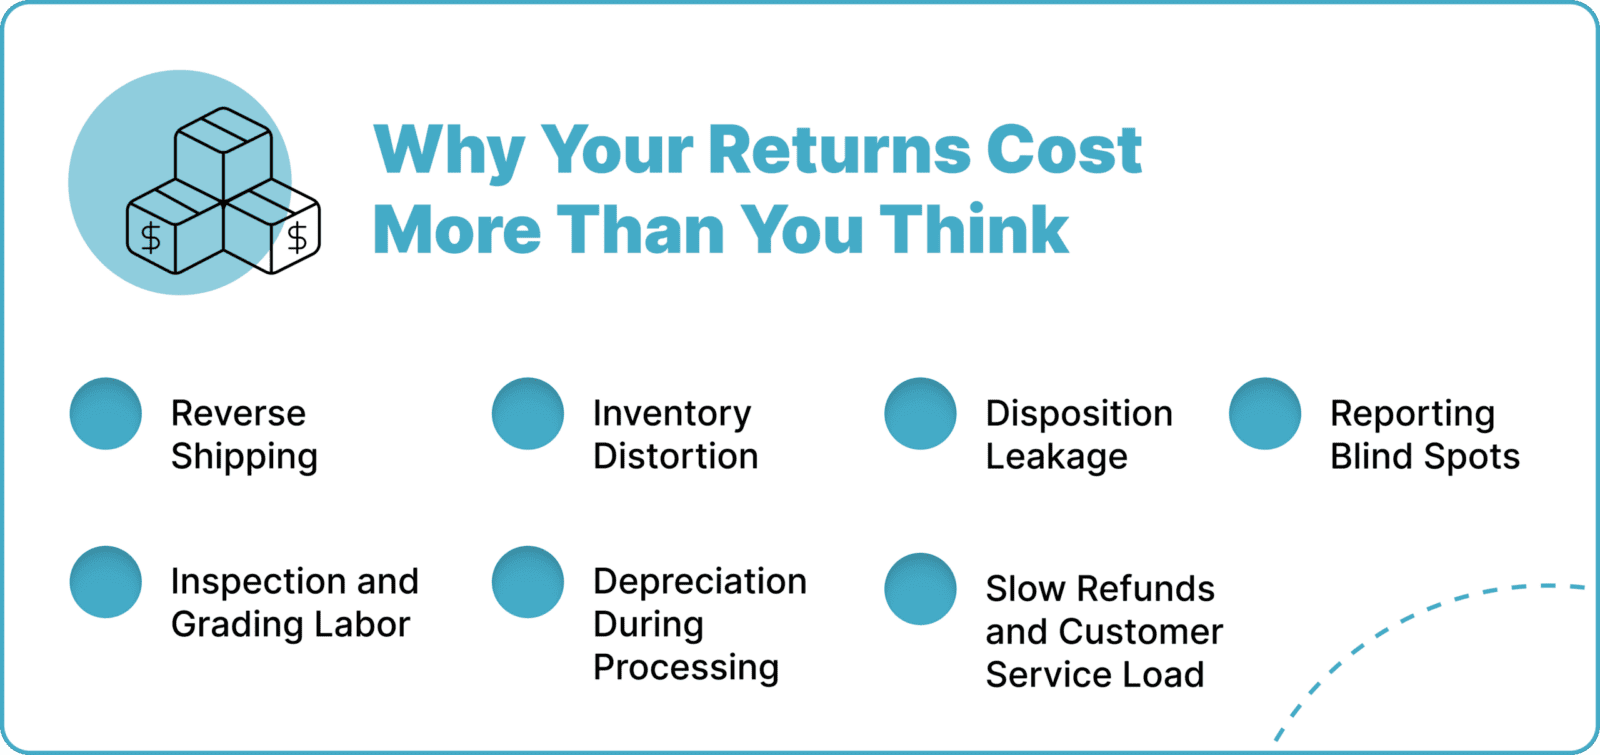
Why Your Returns Cost More Than You Think
The figure that most companies quote for the cost of returns is almost always an understatement of the real cost.
These are the hidden costs that make up the real number:
1. Reverse Shipping
Free returns do not come free. Every prepaid return label, every expedited pickup, and every consolidated shipment back to a warehouse adds to the return costs. According to the National Retail Federation, the average return rate across the retail industry was 15.8% in 2025. But for online purchases, it was much higher. With that kind of return-shipping volume, the costs will add up pretty quickly.
2. Inspection and Grading Labor
All returned products need time and manpower. But without clear grading rules, workers are making subjective calls that change from shift to shift and from one facility to another. For example, one team may mark a returned item as restockable, and another team may mark it as damaged. That inconsistency drives up the manual processing costs.
3. Inventory Distortion
Demand planning systems do not see returned items sitting in a processing queue. That means companies are likely to reorder products that are sitting on a dock, waiting to be inspected, which in turn inflates inventory levels and ties up cash that should be working elsewhere.
4. Depreciation During Processing
Every day a returned product stays in a queue, it loses value. For instance, a winter coat returned in January and processed in March has a fraction of the value of one processed in February. Slow processing for seasonal categories can kill any chance of recovering the full price on resale.
5. Disposition Leakage
When the default is to “restock if it looks new, scrap if it doesn’t,” recoverable value is written off too soon. Items that could have been refurbished, sold through another channel, or returned to the supplier for credit end up in the bin because no one had time to properly evaluate them.
6. Slow Refunds and Customer Service Load
Slow refunds create a gap that introduces customer service tickets, chargebacks, and goodwill credits, which tend to compound the original cost. The customer experience also takes a hit, making customers less likely to return.
7. Reporting Blind Spots
For most companies, return cost data is often spread across customer service budgets, shipping accounts, and warehouse labor. However, without a single consolidated view, leadership cannot see the actual per-unit figure, making it virtually impossible to make informed decisions about return policies, free returns, or restocking fees.
How to Fix Your Returns Cost Problem
Fixing the cost of returns in today’s retail landscape is about ensuring that every return is processed to extract the most value with the least operational drag.
Here’s what that looks like in practice:
1. Audit Your True Per-Return Cost
Returns will remain invisible in budget conversations until leadership has a true understanding of the end-to-end cost of a return. To change that, combine labor, transportation, depreciation, and disposition costs into a single figure. That way, it is visible to all.
Getting this right is the first step, and it also makes the case for all that follows.
2. Standardize Grading and Disposition Rules
Create a grading scale for the facility to use and a defined recovery path for each grade. For example, a standard one could go like this: New items go back in stock; slightly used routes go to the secondary sales channel or refurbishment; and broken items are liquidated or cannibalized. The mapping takes the guesswork out of the warehouse floor and reduces processing costs across the board.
3. Process Refunds When the Carrier Scans The Package, Not When The Warehouse Receives It
Instant refunds at the point of carrier scan reduce customer service load, improve customer satisfaction, and protect repeat purchases. The product has days of travel left, but the customer has their money or store credit. It is a simple hack to customer loyalty.
4. Use Return Data to Fix Upstream Problems
Your data on the reason for returns is one of the most underutilized inputs in retail. For example, if you keep getting returns due to the wrong size, you have a sizing chart problem. And if fragile items are arriving consistently damaged, that’s a packaging conversation. Feeding the data back to product, merchandising, and supplier teams helps to reduce future return rates and protect profit margins.
5. Set Up Secondary Recovery Channels Before You Need Them
Get your liquidation partners, refurbishment vendors, and resale platforms lined up before the volume hits. If restock or scrap are the only options at intake, recovery defaults to restock, and the real cost of returns increases.
6. Deploy a Returns Management Platform That Connects Every Step
This is where the framework comes into play. Platforms like ReverseLogix help automate disposition rules, enforce consistent grading across all facilities, and give operations teams a single view of the actual cost to process each returned product. Remove that connective layer, and even a good returns process tends to unravel at scale.
What Changes When You Get This Right?
When your return costs are under control, you can feel the changes throughout the business. For instance, processing costs per return decline, and cycle times get shorter. The faster the movement of goods through grading and disposition before they lose value, the higher the recovery rate on returned goods.
Inventory levels are also cleaner as demand planning finally has the right data on what is coming back and when. But the biggest change is visibility. Leadership stops guessing about how returns affect profit margins and starts making purchase, policy, and supplier decisions based on real numbers. That’s the difference between a returns process that just eats into revenue and one that fights for it.
Get a Grip on Your Returns Costs With ReverseLogix
Returns costs are distributed across enough budgets and teams that no one person ever sees the whole picture. And that’s where ReverseLogix comes in. Our returns management platform automates disposition decisions, applies consistent rules across all facilities, integrates with your existing WMS and ERP systems, and provides leadership with the cost visibility that most companies have been lacking for years. The first step is to find out if you’re paying more than you think for your returns. Get a demo now to see how this works.

Frequently Asked Questions
The cost varies by product category and channel, but industry estimates put it at roughly 30% of an item’s original price, including reverse shipping, inspection labor, restocking, and depreciation. For online shopping returns, the figure tends to be higher due to return shipping costs and higher return rates compared to in-store purchases. Many businesses underestimate the true cost because the data is scattered across different parts of the budget.
Returns management software automates the steps that drive most of the cost. It generates return labels, applies disposition rules at intake, routes returned items to the right recovery channel, and tracks the financial impact in one place. Companies using the right technology typically see faster cycle times, fewer manual processing errors, and better recovery on returned goods. The cost savings show up in lower labor needs, less inventory sitting in the queue, and stronger margins on items that re-enter sales.
A disposition strategy is the set of rules that decides what happens to a returned product based on its condition, the return reason, and its potential resale value. Without one, workers default to either restocking or scrapping, which writes off value that could be recovered through resale, refurbishment, or supplier credits. A clear disposition strategy is one of the fastest ways to reduce the cost of returns without changing return policies or restocking fees.
They can, but the issue is rarely the policy itself. The issue is the absence of data. When companies offer free returns without tracking which customers, products, or channels generate the highest return rates, they end up subsidizing behavior that erodes margins. The fix is not to remove free returns, since that hurts customer experience and sales. The fix is to use return data to identify high-return customers, products with poor fit or quality issues, and patterns that point to a redesign of the buying journey.
Get a Demo
Discover how you can jump-start your returns management efforts with ReverseLogix.