Fixed vs Variable Return Costs Explained

Picture your return volume jumping 40% next month. Would certain costs in the process increase with it, or would they vary with volume? Getting a handle on fixed versus variable return costs changes where you cut costs and what you stop ignoring. This article breaks down your return expenses into two buckets and explains why each needs its own playbook.
Article Summary:
- The key difference is volume sensitivity, not the size or category of the cost.
- Variable return costs increase as return volume grows and are usually addressed first (e.g., warehouse labor and return shipping).
- Fixed return costs stay the same regardless of return volume, making them easy to overlook while they quietly reduce margins.
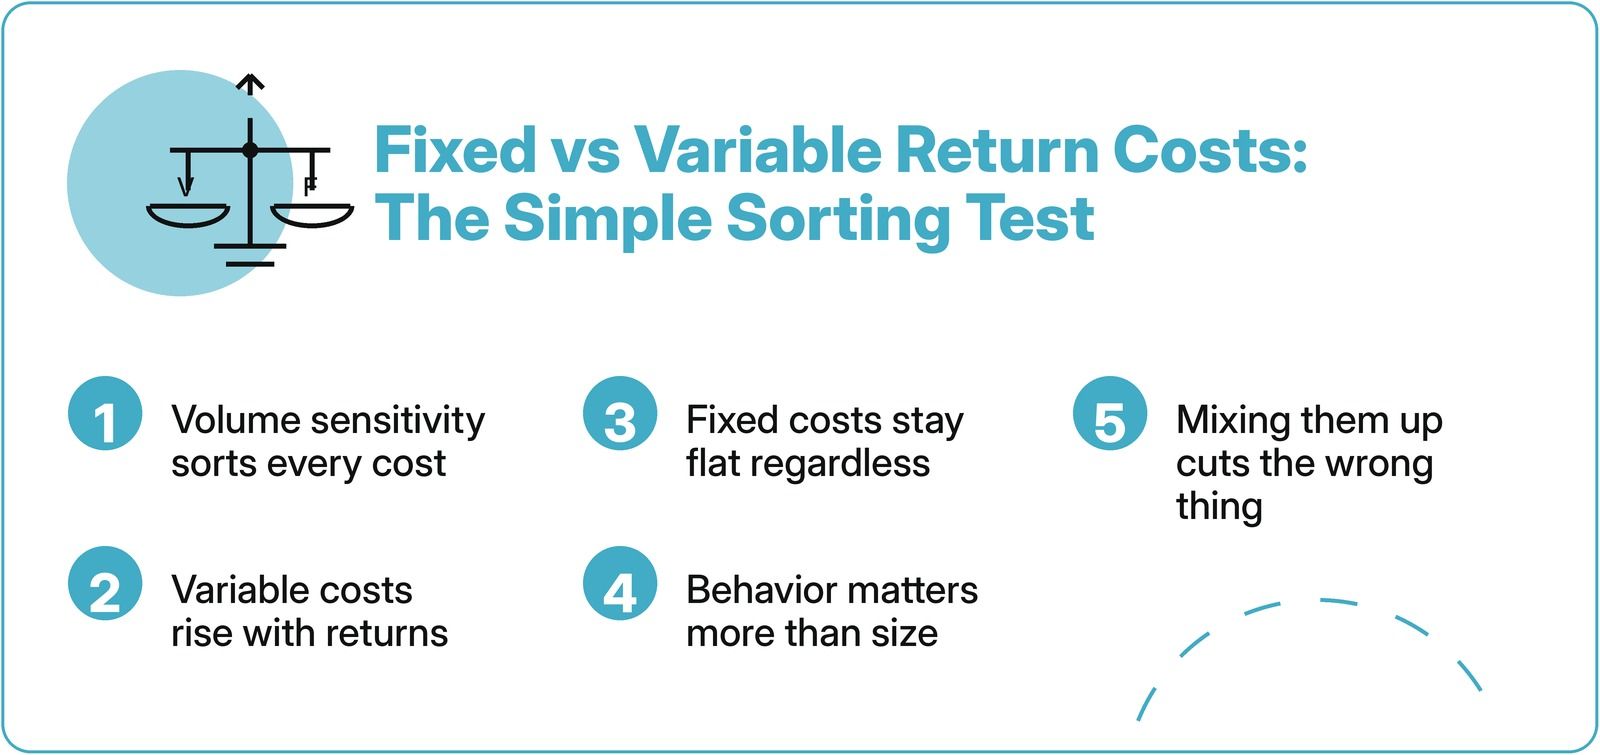
The One Question That Sorts Every Return Cost
All returns management costs fall into one of two buckets (variable or fixed), and a simple test will tell you which. If the cost varies, then it is a variable cost. And if it is barely moving, or not moving at all, the cost is fixed.
Consider a retailer that spends $8,000,000 per month on returns. Divide that bill into two. One slice is return shipping, and the other is warehouse hours spent inspecting items. It also increases by about 50% when the holiday rush drives returns up by half. The other slice contains the bay in the warehouse set aside for reverse logistics and the salaries of the support team. That slice stays there. Same rush, same flat rate. One number responded to volume, while the other stood still. That test does more work than any spreadsheet, because it sorts by behavior, not size.
Run this test on every expense, and the rest of returns management becomes clearer. You start thinking of returns as two problems, each with its own logic, rather than one. Your return processing is responsive to the bucket variable. The fixed bucket follows the way you’ve built the operation. Mixing them up can make you cut the wrong thing, which is what most teams actually do.
Variable Costs: The Ones That Scale With Volume
Variable return costs track your return count almost step for step. They are the costs you can see move in real time, which is an advantage and a trap. Here are some examples:
1. Returns Shipping
The most obvious variable cost is return shipping. Each returned item has a fee. Run them through multiple carriers, and the math still adds up: more units, more labels, and more money out the door. This line is hit first and hardest by the spike in return rates. The cost increases in steps because it has always been linked to the count.
2. Warehouse Labor
The work of inspecting and restocking each returned product is simple volume math. One worker can do so many returns in an hour. Double the returns, and you need to double the hours, whether it is through overtime or temps. When a returned item arrives, someone has to open it, check it out, and decide where it goes. That human time scales with every box that comes back.
3. Markdowns and Refunds
Each item that cannot be sold at full price again incurs its own loss. And markdowns increase or decrease depending on the volume of returns. More returns equals more markdown. The same goes for partial refunds and store credit, both of which are processed per transaction. Give a store credit for one return, and you’ve spent a few minutes and a slice of margin. If you issue ten thousand, the price is ten thousand times.
The trap with the entire variable cost is that because they move fast, the returns team tends to hit them first. Renegotiating carrier rates, speeding up inspections, and tightening the refund policy could reduce the number, which is good. But it is only half the bill, and chasing it can take the spotlight away from the half that never flinched.
Fixed Costs: The Ones That Erode Margins Regardless
The costs of fixed returns are often hidden. But they are the same whether return volume is high or low, and this consistency makes them go unnoticed. Nothing about them sets off an alarm. In a busy month, they don’t jump, and so no one flags them. But they quietly nibble away at the same amount of margin month after month. Here are some examples:
1. Support Teams
The size of support teams that keep customers informed is about the same in a slow week as in a frantic one. “You can’t just hire and fire agents on a daily basis. And so the salary line stays fixed, and volume moves around it. But in a quiet month that fixed headcount is thinly spread across few returns. In fact, when business is slow, the cost per return increases, the opposite of what most managers expect.
2. Infrastructure and Space
With regard to warehouse space for reverse logistics, the square footage rather than the volume of items returned is paid for. That means if you reserve a bay for returns and that bay is the same price full or empty, the standing cost of the exchange process and the policy infrastructure behind it is the same regardless of how many customers actually use the exchange option.
A low return rate does not rescue a company burdened by bloated fixed return overhead. You can lower your return rate and still bleed margin from fixed costs that were never coupled to volume in the first place. That’s the quiet erosion that doesn’t advertise itself. Nor does it spike. It just stays the same and bleeds financial resources irrespective of the return count.
Managing Each Type of Cost Differently
The two cost types need opposite playbooks. And using the wrong one wastes money. Once you’ve run the volume test on your expenses, you act on each bucket differently. However, you can’t manage what you don’t disaggregate. So start by mapping every return expense into fixed or variable on paper, before you touch a single line item.
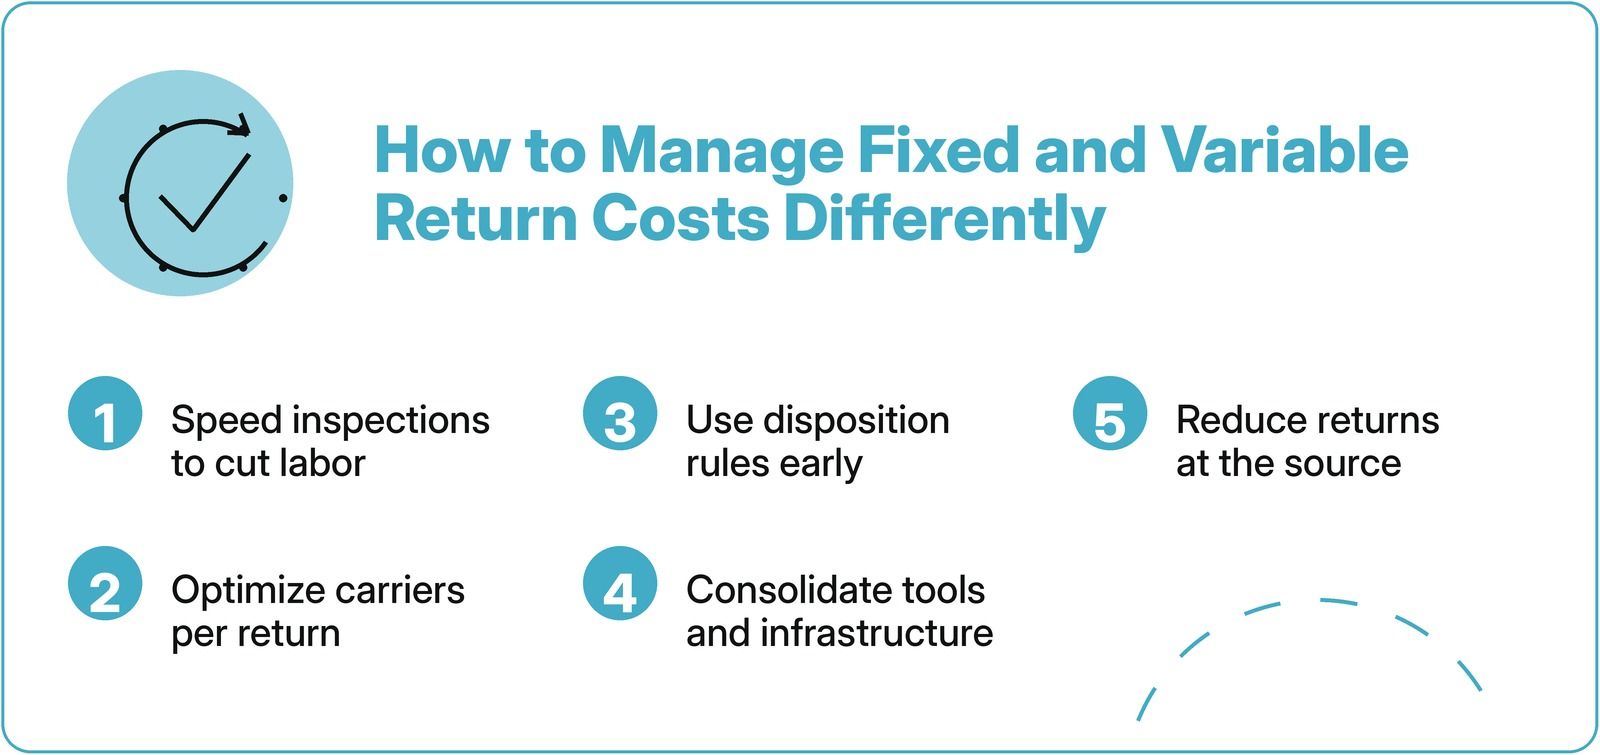
For variable costs
- Make inspection faster so hours of labor per return are less.
- Adjust your carrier mix, so each returned item ships at the best rate across multiple carriers.
- Use smarter disposition rules so that fewer items are marked down, and more get back to full price.
Each of these factors drives down the cost per return so the savings increase with volume.
Fixed costs are more about consolidation and better systems, rather than a headcount panic. Cutting support staff to trim a fixed line seems decisive, but it breaks the customer experience, and the margin damage shows up later as lost repeat business. Instead, redistribute the fixed load over more volume by consolidating tools and making the infrastructure you already pay for carry more weight.
Then there’s the one move that lowers both buckets at once: cutting return volume at the source. A return rate significantly higher than the rest of a product category is usually a problem that can be fixed, such as a misleading product photo, a sizing issue, or a packaging issue. Fix the cause, and fewer items will come back.
This way, you reduce the variable cost of the bill and let your fixed overhead support a leaner operation. When executed properly, a clean returns process is no longer just a cost center. It becomes a competitive advantage because customers who get a smooth exchange process and a fast refund come back. And that retention is worth more than the few dollars you saved squeezing a shipping rate.
See Both Cost Types Clearly With ReverseLogix
You can’t manage what you can’t separate, and the fixed half of your return costs hides precisely because nothing flags it. ReverseLogix provides real visibility into the cost of your customer returns. We separate the variable from the fixed and track both across every facility. The platform captures return data at each step, reports on the full life cycle, and shows leadership where margin actually goes. This way, you have a fixed-vs-variable split in one place rather than putting it together from scattered reports. Contact us today to get started.
Frequently Asked Questions
Not anymore, though plenty of companies still treat them that way. A returns process that’s fast and clear builds customer loyalty and repeat sales, which turns a cost into a competitive advantage. The cost is real, but the value created by handling returns well can outweigh it when the operation is built right.
Return rates and return expenses swing widely by product category. Apparel sees high return rates due to sizing, and each returned item often requires inspection and potential markdown. Electronics return less often but carry higher value per unit and steeper depreciation. The fixed-versus-variable split holds across all of them, but the size of each bucket shifts with what you sell.
E-commerce returns hide costs beyond the obvious refund. A customer sends an item back in just a few clicks, but behind that simple action lie return shipping, warehouse labor, restocking, and the risk of a returned product that can’t be resold at full price. Industry data puts the cost of processing a single return at 20% to 65% of the item’s original value, with most of it invisible at checkout.
Customer expectations push return expenses up on the fixed side. Shoppers now expect free return shipping, easy in-store returns, and a smooth exchange process, and meeting those expectations means standing infrastructure that costs the same regardless of volume. Keeping customers informed with status updates requires support teams and systems that run regardless of whether returns are high or low.
Get a Demo
Discover how you can jump-start your returns management efforts with ReverseLogix.