Most discussion of retail growth is about sales: how much product is moving, and how fast.
For the software side of this topic, see ecommerce returns management software.
Less often mentioned: 16.6% of total U.S. retail sales were returned in 2021, according to the National Retail Federation (NRF). Up to 30% of B2B sales may be returned (Forrester). These return volumes affect companies’ costs, efficiency and profitability.
This article covers the biggest factors driving a company’s return costs and how to reduce them.
The Costs of an Online Return and Refund
The volume of online returns is driving up costs for B2C and B2B sellers. Research has found that the cost of managing a return is about 17% of the prime cost, while others estimate the cost to beas high as 30%.
A study by ReverseLogix, conducted with Lead to Market, reported that 80% of retailers interviewed said their returns’ cost are “significant to severe.” Here is a breakdown of those major costs:
- Warehouse and equipment costs: The warehouse space and machinery needed to manage 10-30% return rates was noted as the highest source of returns costs.
- Transportation costs: The cost of a “free” return for the consumer, plus the cost of moving goods from a store or central warehouse to the final dispositioning place.
- Labor costs: The costs of warehouse employees managing the return; the costs of customer service teams handling questions about returns, refunds and exchanges; plus labor tasks related to restocking, reselling or recycling an item.
- Environmental costs: According to McKinsey, an estimated 10% of all returns end up in a landfill.
Top Reasons for a Return
The most common reasons for returning products vary by industry (automotive purchases lead the pack, with 1 in 5 purchases returned), so be sure to track return reason codes for your own enterprise. Aggregate and study the data to get specific insights into why your customers are making a return, which will help you potentially minimize returns before they happen. The more you understand why a customer returns a product, the more you can use post-purchase behavior analysis to your benefit.
The Customer Changed their Mind
This is a common reason for eCommerce purchases, where the customer can’t see or feel the actual item. Customer reviews and detailed product descriptions with photos give customers a better understanding of the product.
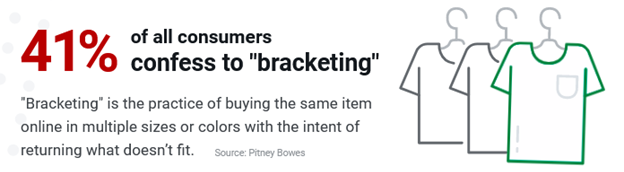
The Customer is Bracketing
Bracketing means buying multiple sizes or styles and keeping only some of them. The home has become the fitting room. The result for retailers is high return rates, higher costs to manage returns, and higher environmental costs due to increased transportation emissions and landfilling.
The Item Arrived Damaged or Defective
In this case, an exchange – rather than a refund – may be in order. It’s estimated that 5-30% of items are returned because they arrive damaged or faulty. Implementing the right returns technology can help you repair items quickly and minimize costs.
Using Returns Management Software to Keep Customers
Although the best return is a return that never happens, the second best return is one that gets the customer to make another purchase.
That is why an easy, positive returns experience matters. Two-thirds of buyers check a company’s returns policy before purchasing. A positive returns experience strongly affects whether that customer will purchase from you again.
Returns management software makes an easy returns experience possible. ReverseLogix gives B2C, B2B and hybrid companies:
- A fully branded, intuitive returns portal
- Customer-centric features
- Self-service returns
- Easy exchanges
- Instant crediting
Companies that use ReverseLogix improve customer satisfaction 15-25%.
“We’ve seen a massive difference in giving customers the returns portal. They love how easy it is and how they can always see the status – and it costs so much less for us to manage.”
– ReverseLogix Customer
How to Maximize Returns Profitability
Returns will not go away, and they are becoming more complex as buying habits change. The goal is to minimize returns and process them as efficiently as possible. Consider these strategies for reducing the cost of product returns:
- Direct consumers to return their item at a local store or fulfillment center, rather than through the mail. Many shoppers prefer making an in-person return, and McKinsey found it’s less expensive to manage returns made at a physical location than those received in the mail. In addition, return processing time can be cut by up to 18 days, improving the likelihood that the item can be resold at full or near-full price.
- Use ReverseLogix RMS data: ReverseLogix is the only RMS that delivers start-to-finish insights on your return reasons and processes. Catch quality issues that are driving high return rates, track key metrics to stay ahead of problems, and minimize returns.
- Poor shipping and handling processes can lead to high costs. Use RMS shipping data to pinpoint inefficiencies in shipping costs.
- Use microfulfillment centers (MFCs) to process returned goods efficiently. Because MFCs are located in densely populated areas, they can potentially lower return costs due to shorter transportation times and the ability to get items back on the shelves quickly.
Rethink Return Policies
With return volumes going up, and transportation and processing costs increasing, companies are rethinking aspects of their returns policy. Consider:
- Charging a nominal fee for product returns.
- Tracking customers who have extremely high return rates, and set rules around the number of returns allowed in a certain time period.
- Setting a cutoff date for holiday returns, so you’re not managing them for months after the holidays.
- Placing restrictions on popular orders, requiring a shorter period for returning them so you can get them back on the shelves faster.
Return policies must be easy for your customers to understand and follow, and reasonable for your business.
Automating Returns to Lower Costs
For decades the focus has been on automating transportation, warehousing and inventory management. Automating returns operations is now possible with RMS technology. View our pricing plans to learn more.
From start to finish, an RMS automates returns management to keep costs low.
- Standardize workflows across your facilities and partner locations, so you’re not losing money to guesswork.
- Gain clear visibility into costs and inventory tracking, so you always know where products are located.
- Manage customer registrations, perform in-warranty and out-of-warranty repairs, track parts and their value, and perform multi-level repairs in which everyone works in the same software platform across facility locations.
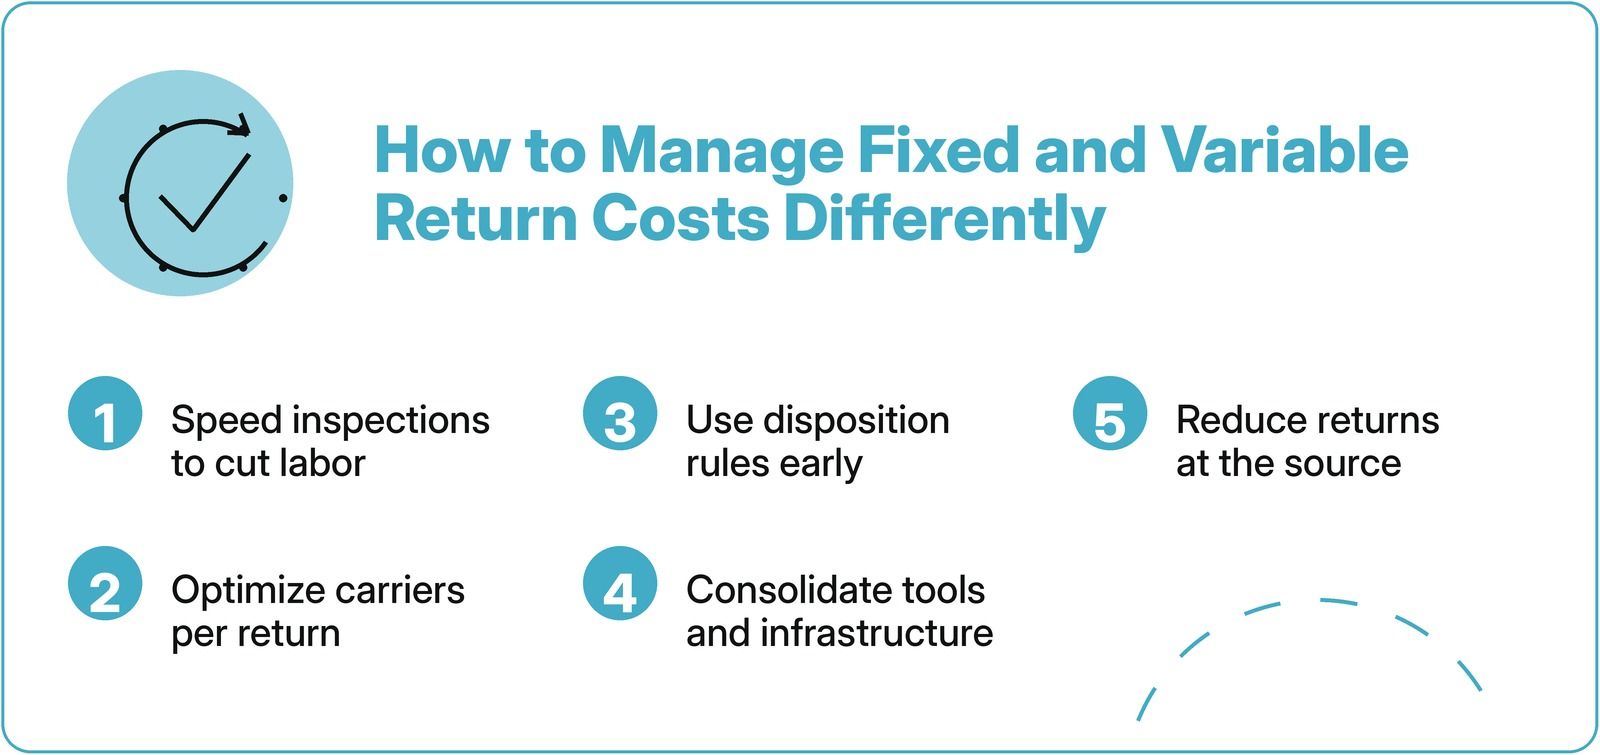
Fixed vs. Variable Return Costs
Variable Costs: The Ones That Scale With Volume
Variable return costs track your return count almost step for step. They are the costs you can see move in real time, which is an advantage and a trap. Here are some examples:
1. Returns Shipping
The most obvious variable cost is return shipping. Each returned item has a fee. More units mean more labels and more cost, whichever carriers you use. This line is hit first and hardest when return rates spike.
2. Warehouse Labor
The work of inspecting and restocking each returned product is simple volume math. One worker can do so many returns in an hour. Double the returns, and you need to double the hours, whether it is through overtime or temps. When a returned item arrives, someone has to open it, check it out, and decide where it goes. That human time scales with every box that comes back.
3. Markdowns and Refunds
Each item that cannot be sold at full price again incurs its own loss. More returns mean more markdowns. The same goes for partial refunds and store credit, both of which are processed per transaction. Give a store credit for one return, and you’ve spent a few minutes and a slice of margin. Issue ten thousand and the cost is ten thousand times that.
Because variable costs move fast, the returns team tends to address them first. Renegotiating carrier rates, speeding up inspections and tightening the refund policy all help. But they are only half the bill, and focusing on them can take attention away from the fixed half.
Fixed Costs: The Ones That Erode Margin at Any Volume
Fixed return costs are often hidden. They are the same whether return volume is high or low, so nothing about them raises an alarm. They take the same amount of margin month after month. Here are some examples:
1. Support Teams
The support team that keeps customers informed is about the same size in a slow week as in a busy one. You cannot hire and release agents day by day, so the salary line stays fixed while volume moves around it. In a quiet month that fixed headcount is spread across fewer returns, so the cost per return goes up, the opposite of what most managers expect.
2. Infrastructure and Space
Warehouse space for reverse logistics is paid for by the square foot, not by the number of items returned. A bay reserved for returns costs the same full or empty, and the systems behind your exchange process and returns policy cost the same however many customers use them.
A low return rate does not rescue a company with heavy fixed return overhead. You can lower your return rate and still lose margin to fixed costs that were never tied to volume.
10 Metrics for Measuring your True Returns Costs
Uncovering the total cost of product returns will give you a more accurate net sales number and may reveal areas for process improvement. Here are 10 metrics to track for measuring the cost of your product returns:
- Cycle time: How long does it take for an item to get through your returns processes and to its final destination? Be sure to track this metric according to whether an item can be resold, returned to vendor, recycled or thrown away.
- Total product reclaimed and resold: Reselling items will help recoup some or all of the COGS.
- Value from resale/recapture revenue: Measure how much you are recouping, plus any profit.
- Per-item handling costs: Every time someone touches an item in the warehouse, there is a cost. Break down this metric by department or location, so you can compare and identify where teams perform best.
- Lost sales commissions (depending on the marketplace): If you sell on a third-party marketplace, know how much a returned item costs you in terms of commissions, fees and marketing.
- Marketing costs: Can you tie ad spend or marketing efforts to a specific item or product category? That is a lost cost if the item is returned.
- Disposal costs: If an item can’t be recycled or resold, measure the disposal cost and be sure to include the cost of preparation, storage and transportation.
- Waste, energy and recycling metrics: Identify how much of your product can be recycled, how much is sent to landfills or incinerated, how far each product must travel in the returns process, and how much energy is consumed in returns.
- Transportation costs: This includes fuel, drivers, vehicle wear and tear, etc.
- Packaging costs: What is it costing you to recycle or throw away the packaging that a returned item arrives in? Are returned packages different sizes and shapes, which makes it less efficient to handle and store them? What is the cost to package up returns for dispositioning? If an item is exchanged, be sure to factor in the packaging cost of the new item sent to the customer.
These 10 costs, factored into your return rates, give you two results:
- Per-item handling costs: In addition to knowing your per-item handling costs, you should have the data to break down costs by product category or type. If you have multiple facilities, you may also want to calculate the per-item cost per facility to find areas to improve. Plot this cost throughout the year to determine any seasonality to your costs.
- Total product cost: You are already tracking the cost of goods sold, but to get a true sense of the cost to your business, you need a “total cost of ownership” metric that includes COGS, initial shipping, returns processing, return shipping, marketing, and disposition costs minus any money you can get for resale or disposal (such as return-to-vendor).
Knowing this information will help you improve product offerings, create better online listings, choose higher quality vendors (if you experience a high volume of returns for errors), and improve the customer’s returns process.
Get a Demo
Discover how you can jump-start your returns management efforts with ReverseLogix.