

Franken-System Cost Calculator: what returns cost across an ERP, WMS and portals never built for them
This is the ERP vs returns software question with a number on it. An ERP keeps the ledger, a returns software platform runs the return, and a returns software system that owns the whole lifecycle removes the hand-offs priced below. An OMS, a WMS, an ERP, a returns portal, repair and warranty tools, spreadsheets, and the integrations holding them together. Five short steps put a number on the seats, the upkeep, the hours lost between systems and the returns that fall through the gaps: the cost of disconnected returns systems, added up once.
Trusted by logistics teams at:





Proven outcomes across enterprise deployments
Deployment-level numbers, each traceable to a named source.
$25M+
in savings after ReverseLogix deployment
Large Global Appliance Manufacturer
50-60%
faster returns vs a legacy SAP system
Samsonite
25%
higher customer satisfaction
Jabra
4-6 wks
standard go-live (vs 12-18 mo ERP build)
ReverseLogix deployment data
ERP vs returns software: each does its job, none owns the return
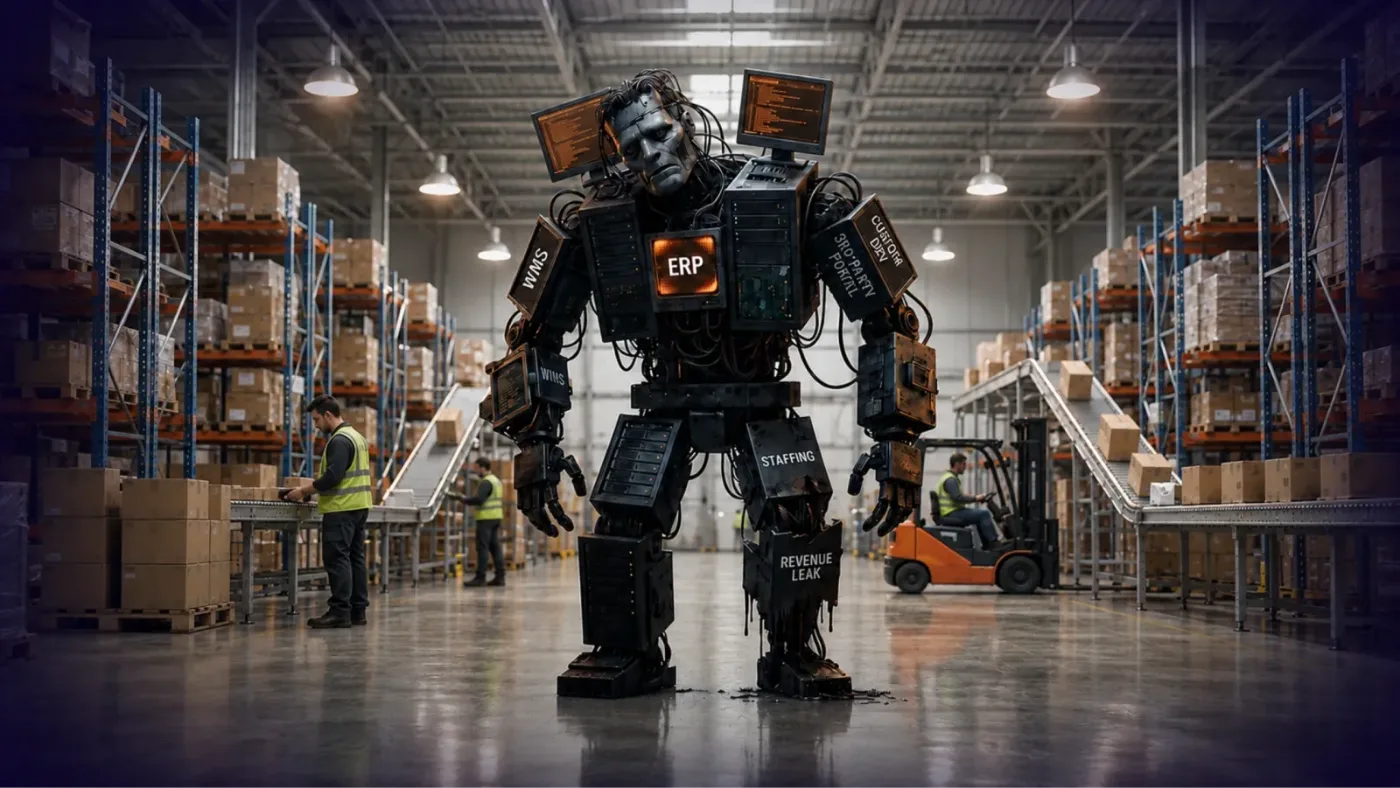
Order management knows what was sold. The warehouse system knows what is on the shelf. The ERP knows what was invoiced. A third-party portal prints the label. Repair, warranty and recommerce each have a tool of their own, and the gaps between all of them are filled with custom code, middleware, spreadsheets and people re-keying the same return four times. That is the Franken-System, and it is how most enterprises handle returns today.
It is not a knowledge problem. Every team we talk to knows the lag, the tech debt and the absence of one source of truth for returns, and knows where the ERP’s returns management stops. It is a cost that has never been added up, because it is spread across IT, operations, support and finance budgets. This calculator adds it up.

See your Franken-System mapped against one system.
ERP vs returns software: what changes when one system owns the returns lifecycle
Seats: support, service and warehouse staff work returns in a system built for them, so ERP and WMS licenses go back to the people who actually need them. Integrations: the returns system holds the RMA record and posts to ERP and WMS once, replacing the web of point-to-point connectors and the upgrades one system keeps forcing on the others, and it settles the build-versus-buy question for the custom code. Handoffs: intake, entitlement, inspection, disposition, refund and repair live in one record, so nothing is re-keyed and status is visible to everyone, including the customer.
Exceptions: rules run at intake, not at the dock, so returns stop falling through the gaps between systems. Reporting: one source of truth, with finance, operations and customer experience reading the same numbers. That is what a system of record for returns removes: the cost of a manual returns process run across tools that were built for something else. For the labor side of that saving, run the returns ROI calculator; for the whole bill, the total cost of returns calculator.
ERP vs returns software: questions and answers
The set of systems a return passes through when no single one of them owns it: order management, warehouse, ERP, a carrier or returns portal, repair and warranty tools, spreadsheets, and the custom code and middleware that connect them. Each was built for something else, and the return is handled in the gaps.
Licenses and seats used only to handle returns, including ERP and WMS seats for support and warehouse staff; integration and middleware upkeep; custom development and third-party support; the hours staff spend moving a return between systems; the returns that fall through the gaps and have to be reworked; and the reporting effort to reconcile it all.
No. ReverseLogix sits alongside them as the system of record for the return and posts to the ERP and WMS once. The seats and integrations the calculator counts are the ones that exist only because returns are handled across systems.
It is built from your own inputs, with defaults you can change on every step. Treat it as the first version of a business case: the downloaded report lists every line so IT, operations and finance can correct their own numbers.
No. ReverseLogix sits alongside your ERP as the system of record for the return and posts to it once, so an ERP returns module can keep its financial postings. What the calculator counts is the seats, integrations and swivel-chair time that exist only because the return itself is handled across systems.
Further reading: National Retail Federation research on retail returns
See what one system removes from your Franken-System
Know your number? Book a Returns Assessment. A specialist draws your current returns flow across every system it touches and shows what a single system for the lifecycle removes, before any demonstration.
4-6 wks
standard go-live, vs 12-18 months for an ERP build
ReverseLogix deployment data


