

Returns TCO Calculator: the total cost of ownership of your returns operation in a year
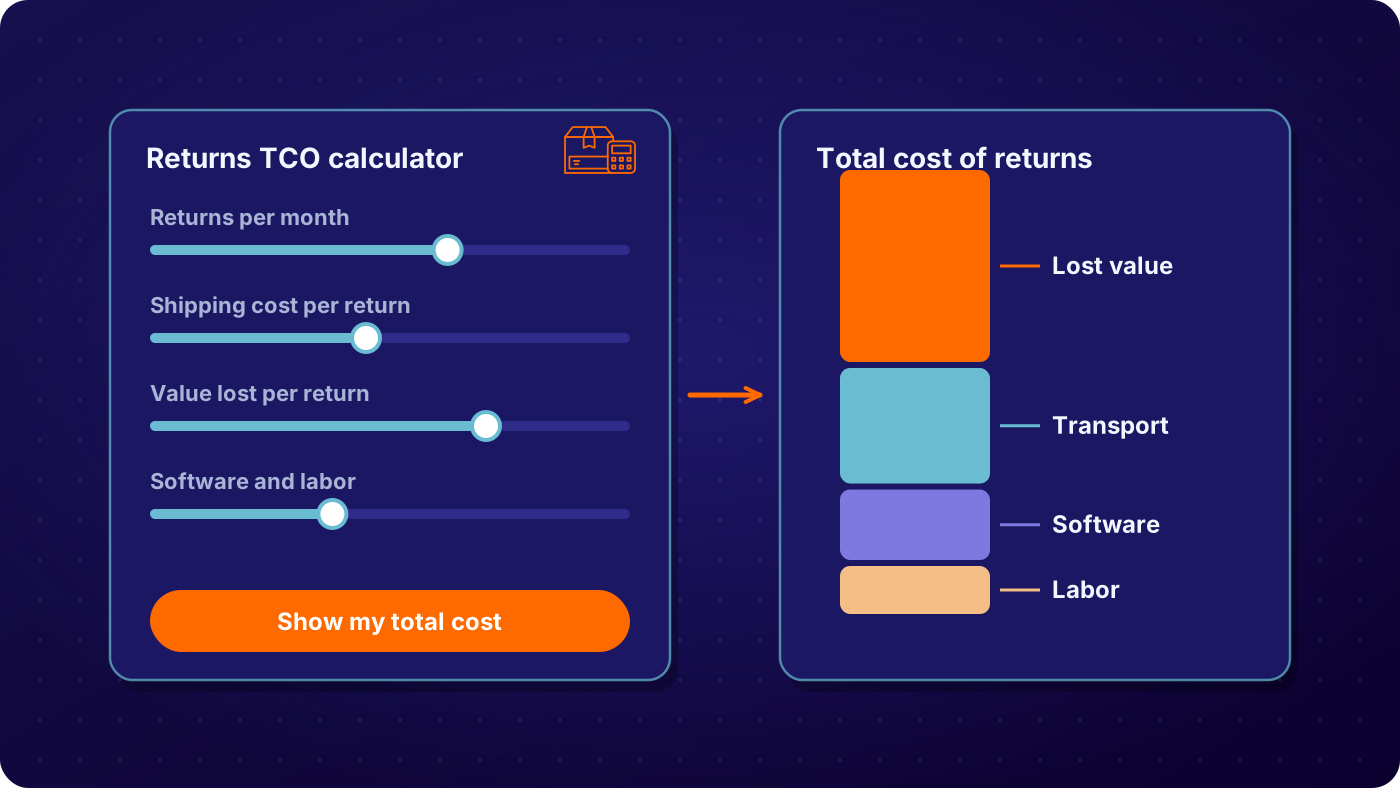
The returns TCO calculator builds the total from your own numbers in five short steps: volume, people, transport, lost value, and customer contact and tools. The total builds as you answer. Download the report to see each bucket and take it to finance.
Trusted by logistics teams at:





Proven outcomes across enterprise deployments
Deployment-level numbers, each traceable to a named source.
$25M+
in savings after ReverseLogix deployment
Large Global Appliance Manufacturer
50-60%
faster returns vs a legacy SAP system
Samsonite
25%
higher customer satisfaction
Jabra
4-6 wks
standard go-live (vs 12-18 mo ERP build)
ReverseLogix deployment data
Why the labor line is the smallest part of the total cost of returns
Most teams budget returns as a headcount problem, because that is the number they can see. In practice the larger costs sit in inventory: units that come back and cannot be sold as new, units that sit in a receiving bay for weeks while their resale value falls, and refunds paid on goods that never arrived. Carrier spend on return labels is usually the second largest bucket, and it grows with every return that is routed to the wrong location.
This calculator puts those buckets side by side so the conversation with finance starts from the whole cost of returns, and from the cost per return that falls out of it. To see how much of it returns management software takes out, run the returns ROI calculator with the same people and volume figures. To price the systems you run returns on today, use the Franken-System calculator.

See which of these costs a returns system removes.
What moves each bucket in the cost of returns
People: the time goes into lookups, not lifting. When eligibility, RMA creation and disposition rules run at intake, customer service stops investigating and the warehouse receives against a known RMA. Transport: routing each return to the nearest location that can process it, and consolidating low-value units, cuts paid inbound shipping. Lost value: deciding disposition at intake, whether restock, refurbish, liquidate or recycle, raises recovery and shortens the time goods sit unsold. These are the hidden costs of reverse logistics that never appear on a headcount plan.
Refund leakage: releasing refunds on receipt and inspection rather than on label creation closes the gap between what was promised and what came back. Customer contact: status visible to the customer at every step removes most of the "where is my refund" volume. Tools: one system for the whole lifecycle replaces the carrier portals, spreadsheets and custom scripts that grew up around the problem.
Frequently asked questions
Six buckets: the people who handle returns, return shipping you pay for, inventory value lost to write-offs and low recovery, refunds paid on fraudulent or missing returns, the customer contacts each return generates, and the software and tools you pay for today. The calculator adds them from your inputs and shows the cost per return.
Total annual cost divided by the returns you handle in a year. It is the number finance teams use to compare returns against other operating costs, and the one that moves fastest when disposition decisions happen at intake instead of at the dock.
It applies the reductions ReverseLogix customers report to each bucket: labor, shipping, lost value, fraud and customer contact. It is an estimate, not a quote. The report you download shows the assumption behind each line so you can adjust it.
No. The ROI calculator prices the labor side only and shows what automation saves. The returns TCO calculator prices the whole returns operation so you can see where the money goes before deciding what to fix first.
Further reading: National Retail Federation research on retail returns
See which of these costs a returns system removes
Have the total in hand? Book a Returns Assessment. A specialist walks your intake, disposition and refund flow and shows where value leaks, before any demonstration.
4-6 wks
standard go-live, vs 12-18 months for an ERP build
ReverseLogix deployment data


