

Returns analytics software that shows why items come back, by SKU, size, fit and cost
Returns analytics software turns every return into a clear answer about why it happened, what it cost and what to fix. It reads from the same record that runs the return, so nothing is re-keyed or stale. No more monthly report that says how many came back and never says why.
Manufacturers and retailers around the world run their returns on ReverseLogix. Here are some of the brands we work with.





Returns cost far more than most reports admit
Returns are not a rounding error. They are a large, steady drain, and most teams see only a slice of it. These numbers measure different things: the cost of handling a return, the share of online sales sent back, and the share of all returns lost to fraud or abuse. Fraud is deliberate theft. Abuse is bending the rules.
30%
Of an item’s value is what returns cost to process, about $211B in total
Appriss Retail, Total Retail Loss Benchmark, 2026
19.3%
Of online sales are projected to be returned by US shoppers, within $849.9B of returns
NRF and Happy Returns, Retail Returns Report, 2025
2%
Of the $706B in returns in 2025 was fraud, about $14B of deliberate theft
Appriss Retail, Total Retail Loss Benchmark, 2026
12%
Of those same returns was abuse, about $86B of customers bending the rules
Appriss Retail, Total Retail Loss Benchmark, 2026
Why most returns reports explain how many but never why
Most returns reports are built after the fact. Someone exports data from three systems, joins it in a spreadsheet and sends it around weeks later. By then the season has moved on. The report says how many came back. It cannot say why, so the same problem keeps arriving.
- Reasons are captured when the return starts, in a fixed list and in the customer’s own words, so they can be counted by SKU.
- Inspection and grading results sit next to the reason, so you can see what condition items really came back in.
- Cost per return is built from the steps each return actually went through, not a flat average spread across the month.
- Fraud and abuse patterns show up as they form, by customer, item and channel, not in next quarter’s review.
The difference is simple. A report built from copies is always late. Analytics built on the live record is always current, and it can answer the question your team actually asks: why did this one come back?

Why returns analytics software should read the same record that runs the return
A return touches many hands. The customer gives a reason. A warehouse team receives and inspects the item. A grader decides its condition. Finance books the refund. When each step lives in its own tool, the story breaks into pieces, and nobody can line up the reason with the result. The real cause stays hidden.
Copying that data into a separate reporting tool makes it worse. Fields get renamed. Rows go missing. Someone fixes a number by hand and it never makes it back. Then two teams bring two different totals to the same meeting, and the meeting becomes about whose number is right instead of what to do.
When the analytics come from the record that runs the return, there is one set of facts. The reason, the inspection, the decision and the cost all belong to the same return. Supply chain, merchandising and finance can argue about what to do next, not about what happened. That is a better use of everyone’s time.

What to ask a vendor before you buy returns analytics software
Start with where the data comes from. Ask: is this reporting built on the same record that runs the return, or is it copied in overnight from somewhere else? Ask how old the numbers are when you open a screen. If the answer is “it depends”, keep asking.
Ask about the reason. Can you see return reasons by SKU, by size, by fit and by channel, without asking IT to build a report? Ask to see one real return from start to finish: the customer’s reason, the inspection result, the cost and the final decision, all in one place.
Ask who can use it. Can a merchandiser, a finance lead and a supply chain manager each open it and get an answer without a training course? Then ask about control: who can see what, what is logged, and how the data gets out to the tools your data team already uses.
Where margin leaks when returns analytics software cannot see the reason
Picture a jacket that runs small. Every week, customers order it, try it on and send it back. Each one costs shipping, handling and a markdown on resale. Without the reason tied to that SKU, it looks like normal volume. In truth it is one fixable sizing note on a product page.
Picture a pallet of returns in a corner because nobody agreed what to do with it. Good items wait to be resold while their season ends. Damaged ones get treated as good ones. Every day of waiting takes a little more value out of every box.
Picture one customer sending back an item that is not the one they bought, then doing it again a month later. Each return alone looks small. Together, they are a pattern. Much of fraud and abuse is invisible when every return is judged on its own.
Picture a part that keeps failing in the field. Claims arrive as separate tickets, each one paid and closed. Nobody sees that one supplier batch sits behind most of them. Warranty Week reports $30.37B in warranty claims paid in 2025. A pattern found early is worth real money.
What returns analytics software changes when product, finance and supply chain see the same facts
When reasons, costs and patterns sit in one place, conversations between teams change. People stop asking for another report and start deciding what to do next.
- Product and merchandising see which SKUs, sizes and fits drive returns, and can fix a size chart while the season is still running.
- Finance sees what a return really costs, step by step, and can stop relying on a flat average that nobody quite trusts.
- Supply chain sees cycle times, where returns stall, and which routing choices get items back on sale sooner.
- Customer service and risk teams see repeat patterns across customers and items early, and can act on the pattern instead of arguing each case.
IT and data teams gain too. They connect to one governed source instead of maintaining a pile of exports, and everyone else stops waiting in their queue.
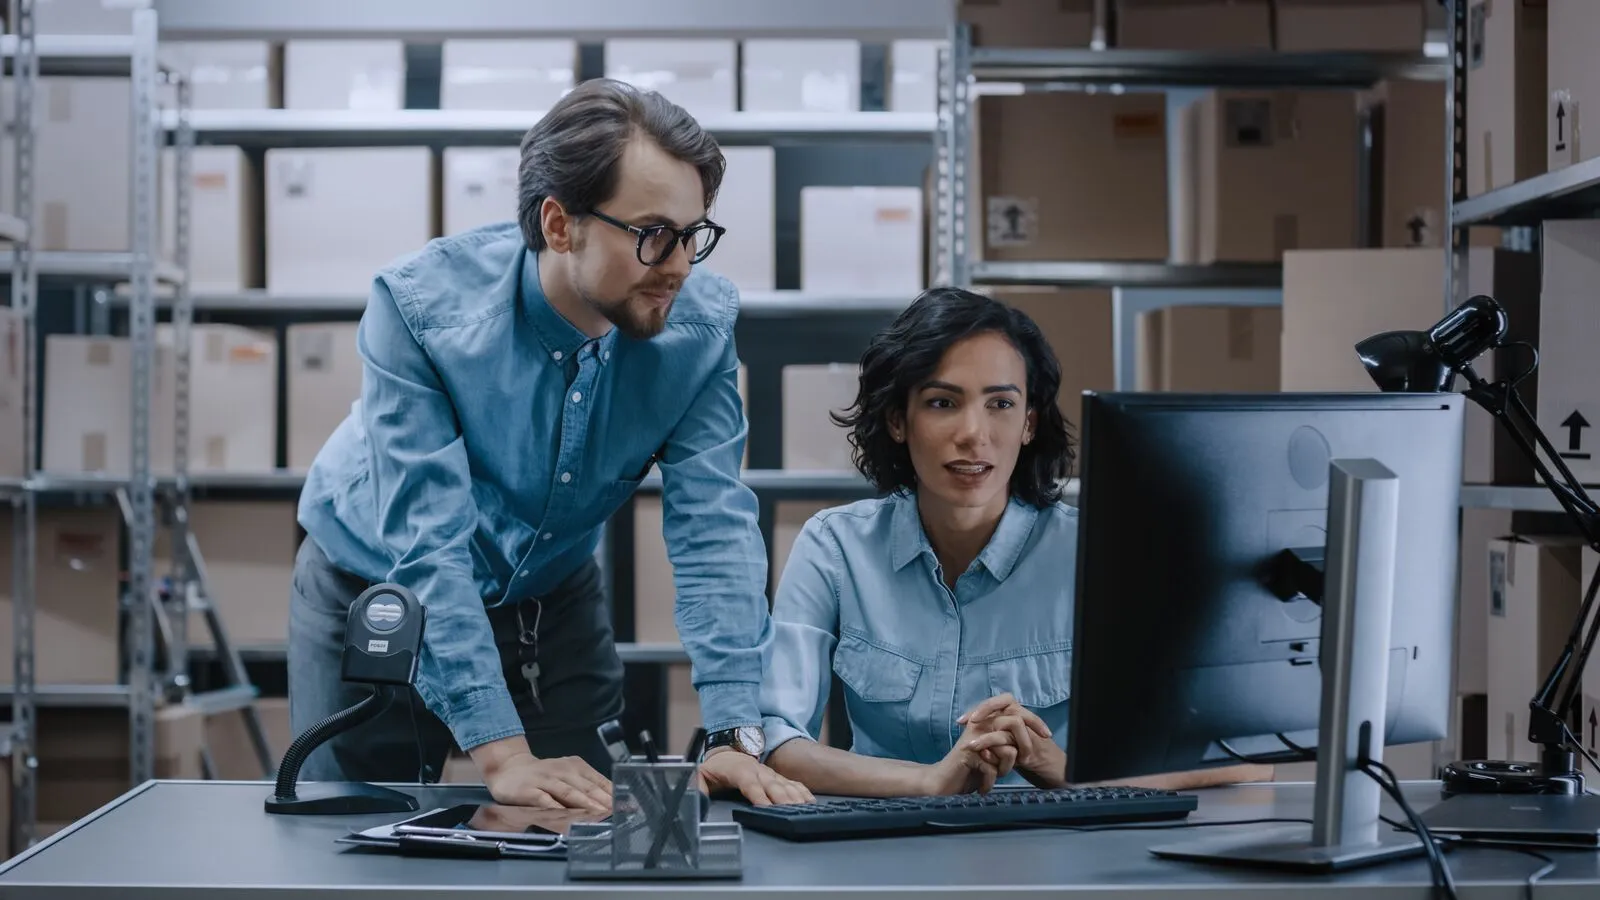
A typical day when the reasons are already on the record
This is a typical flow, a composite and not any one customer. A shopper starts a return in the branded portal and picks a reason. Vision AI checks the photos they submit before the box ships. The reason, the photos and the order details are already attached to the return before it leaves the house.
The item arrives at a warehouse or a repair depot. Staff receive it, inspect it and grade it. The grade and the routing decision join the same record: back to stock, repair, recommerce or disposal. Nobody types the result into a second system, and nobody has to chase it later.
On Monday, the merchandising lead opens the view. One jacket shows a cluster of “too small” reasons. Finance sees what those returns cost. Risk sees one account sending back items that do not match the order. Each person asks their own question of the same record, in the same minute.
How ReverseLogix runs returns analytics software as one governed workflow
ReverseLogix is one returns management system for the whole journey: returns initiation, order tracking, returns processing, warranty claims, repair, asset management, recommerce and B2B returns. Every step writes to the same record, so reporting is not a separate project. It is a view of work that is already happening.
Rules decide what happens to each return, and approvals sit where your policy says they should. Every decision is written to an audit trail, so when someone asks why an item was refunded, routed or rejected, the answer is on the record and not in someone’s memory.
That same trail feeds the analytics. Reasons, inspection results, routing, cost and cycle time stay connected to the return that created them. Teams can look at one SKU or one site, or ask which patterns are growing, and trust that the numbers match the work.

Who returns analytics software fits, and who can skip it
This is a good fit if you handle enterprise return volume, sell across channels or countries, and have more than one team that needs the answer. It fits best when returns, warranty or repair touch several systems and the monthly report is always late.
It also fits when the why matters more than the count. Manufacturers with warranty and repair work, and retailers with size and fit problems, tend to feel the gap first. They already know how many. They want to know what to change.
It is probably not for you if your volume is small, you run one store on a simple Shopify app, and a basic export answers your questions. A lighter tool will cost less and do the job. If that changes as you grow, we are glad to talk then.
Security and access in returns analytics software
Returns data holds customer details, order history and money decisions. It deserves the same care as any other system of record.
- ReverseLogix is ISO 27001 certified, so its security practices follow an internationally recognised standard and are independently assessed.
- ReverseLogix is SOC 2 certified, with its controls for protecting customer data reviewed by an outside auditor.
- Role-based access lets you decide who sees what, so a merchandiser can see reasons and trends without seeing customer details they do not need.
- An audit trail records who did what and when, so every number in a report can be traced back to the decisions behind it.
Better reporting should not mean more people with more access. One governed source is easier to protect than five spreadsheets travelling by email.

Returns analytics software that connects to the systems your data already lives in
Returns analytics is only as good as the systems behind it. ReverseLogix integrates with SAP, Oracle, NetSuite, Shopify, Salesforce and Dynamics 365, so orders, products and financial records line up with the return. Your warehouse systems connect the same way, and your ERP and ecommerce platform stay where they are.
Carriers matter too. ReverseLogix works with more than 400 carriers across more than 100 countries, in multiple languages, so one view can cover returns from many places. Your data team then builds on one governed source instead of stitching together exports from each region.

Returns analytics software: your questions answered
What is returns analytics software?+
Returns analytics software shows why items come back, what each return costs and where returns get stuck. It works best when it reads from the same record that runs the return. Then you can see reasons by SKU, size and fit, cycle times, fraud and abuse patterns, and warranty and repair trends in one place.
How do I find out why customers return my products?+
Capture the reason when the return starts, as a fixed choice plus the customer’s own words, and keep it attached to the item and SKU. Then add the inspection result when the item arrives. Comparing what customers said with what you found shows the real cause, not only the stated one.
How do you calculate cost per return?+
Add up every step a return goes through: shipping, receiving, inspection, repair or repackaging, and lost resale value. Divide by the number of returns. Appriss Retail’s 2026 benchmark report puts the cost of processing returns at about 30% of item value. Your own number will differ by product and route.
What is the difference between return fraud and return abuse?+
Fraud is deliberate theft, such as sending back an empty box or a fake item. Abuse is bending the rules, such as wearing an item once and returning it. Appriss Retail’s 2026 report puts fraud at 2% and abuse at 12% of 2025 returns. Patterns across customers and items help you spot both.
Can returns analytics connect to our ERP and reporting tools?+
ReverseLogix integrates with SAP, Oracle, NetSuite, Shopify, Salesforce and Dynamics 365. Because reporting comes from the live return record, your data team has one governed source to connect to. Ask us about your specific reporting tools and export needs during a demo, and we will answer plainly.
Further reading: National Retail Federation research on retail returns.
See why your items come back, and how many
See what your own returns look like in one view. Book a demo and bring the report you already use. We will show you the why sitting behind it. No pressure, just a straight conversation.
One record.
The reason, the inspection, the cost and the decision, all on the same return.
Bring your current monthly report. We will work from it.


