

Returns ROI Calculator: what returns management software saves on labor
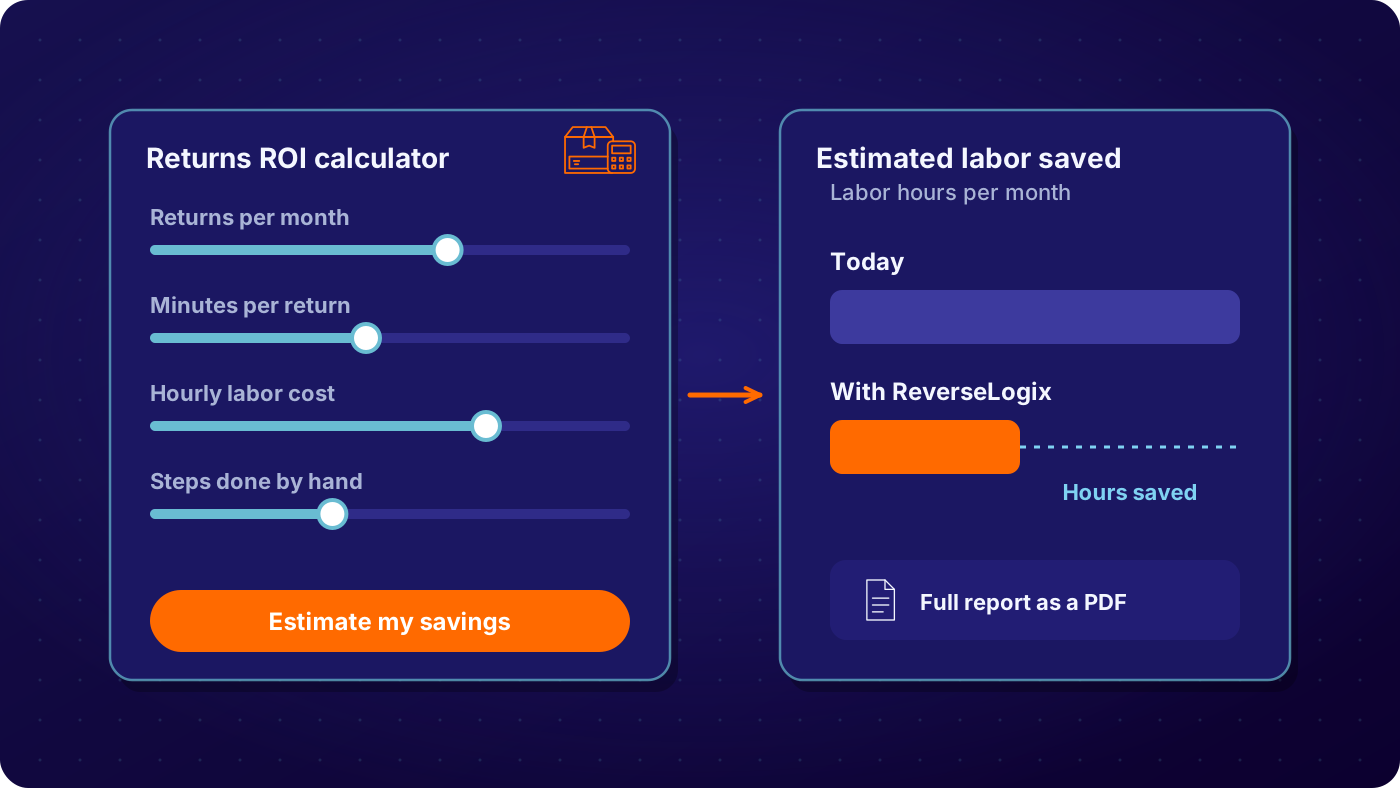
Three short steps: your team, your return volume and the minutes each step takes today. The estimate updates as you answer. Download the full report to see every line item, and take it to your finance team.
Trusted by logistics teams at:





Proven outcomes across enterprise deployments
Deployment-level numbers, each traceable to a named source.
$25M+
in savings after ReverseLogix deployment
Large Global Appliance Manufacturer
50-60%
faster returns vs a legacy SAP system
Samsonite
25%
higher customer satisfaction
Jabra
4-6 wks
standard go-live (vs 12-18 mo ERP build)
ReverseLogix deployment data
What the returns ROI calculator does and does not count
The calculator prices the staff time your returns consume today: accepting and receiving each return, creating RMAs for returns that arrive unannounced, and processing them in the warehouse. It then applies the time reductions ReverseLogix customers report, about 10% in customer service and 15% in the warehouse, and shows the difference as annual savings.
It deliberately leaves out the larger levers, because they depend on your product mix: recovered value from faster disposition, fewer write-offs, fewer customer contacts per return, and lower carrier spend from routing returns to the right location. For the whole bill, run the total cost of returns calculator; for the cost of the systems you run returns on, the Franken-System calculator.

See the numbers against your own returns flow.
Where the time goes in a manual returns process
Most of the labor in returns is not the physical handling. It is the lookups: finding the order, confirming the item is eligible, deciding what to do with it, and telling the customer what happened. A returns management system does that work once, at intake, so the warehouse receives against a known RMA and customer service stops answering "where is my refund" emails. Blind returns are the expensive case. Every unit that arrives without an RMA costs a manual investigation before anyone can put it away, which is why the calculator asks for them separately.
Teams that have moved from spreadsheets and email to ReverseLogix report returns processed 50 to 60% faster, and ROI within days of go-live rather than quarters. The calculator is conservative on purpose; the report you download shows the line items so you can adjust the assumptions to your own operation.
Returns ROI calculator: questions and answers
The labor cost of your returns today, built from the people who touch returns, their loaded hourly cost and the minutes each step takes, and what that cost becomes when intake, RMA creation and processing are automated. The headline is year-one labor savings; the report shows years one to three and time to ROI.
They are the averages ReverseLogix customers report after go-live: about 10% less customer service time per return and about 15% less warehouse time. They are deliberately conservative. Your report lists the inputs so you can change them.
No. Those depend on your product mix, so they sit in the returns total cost of ownership calculator, which adds transport, lost inventory value, refund leakage, customer contact and tools to the labor line.
They stay on the page until you download the report. The download asks for your name, company and email, and the inputs and results are stored with your HubSpot contact so a specialist can walk through them with you. Nothing is shared outside ReverseLogix.
Further reading: National Retail Federation research on retail returns
See the numbers against your own returns flow
Ready to compare the estimate with reality? Book a 30-minute call. A specialist walks your intake, RMA and disposition process and shows where the time goes, before any demonstration.
4-6 wks
standard go-live, vs 12-18 months for an ERP build
ReverseLogix deployment data


