Back-to-School and Holiday Prep: Capture Business Intelligence to Minimize the Returns Hassle


As back-to-school gets into full swing and the holidays approach, retailers are ramping up. Online purchases are expected to grow even more than in 2020, accounting for 18.9% of holiday sales compared to 17.5% in 2020.
But the interaction between customer and store or customer and website doesn’t end after the purchase. An average of 8% of retail products sold in stores are returned, and that number can be as high as 40% for online purchases.
Minimizing the impact of product returns
Managing the influx of product returns this time of year is no small feat. The returns process should be quick and easy for a customer, cause minimal disruption in a store or DC, and avoid being a cost or time burden to a company.
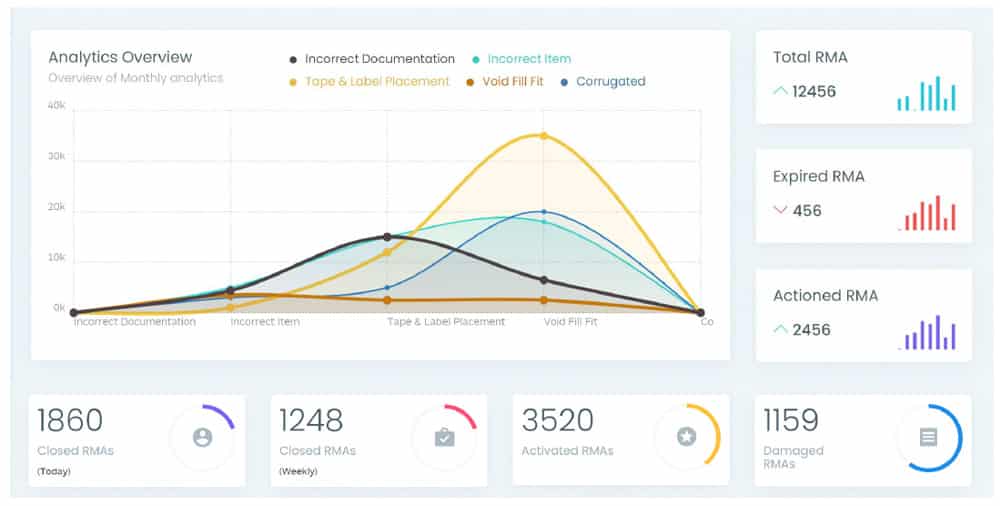
But you can’t make those goals without knowing what’s going on with your returns: the root cause of them, disposition methods, or trends. That’s where business intelligence (BI) comes in.
BI for returns has been traditionally challenging for retailers and ecommerce companies because they’ve had to rely on several point solutions to manage the entire returns process – and piecing together data from lots of sources.
A returns management system (RMS) changes that equation. An RMS gives you one solution – integrated with other supply chain software – that centralizes returns data and presents the best BI to minimize labor resources, smooth out workflows, and keep costs to a minimum.
Surviving the busy season with BI
During the Q3/Q4 back-to-school and holiday seasons, you have to stay on top of returns. Here are some ways BI metrics help you make the best decisions for the business.
What’s being returned and why?
An RMS offers configurable reporting, helping you drill down to the “why” behind the “what.” Uncover whether certain SKUs have a high volume of returns and the customers’ reasons for the return. Is there a defective zipper on a certain backpack? A hot holiday gift item that isn’t meeting its guarantee? Quickly identify defects and vendor issues with business intelligence from your RMS.
Where are the returns happening?
Perhaps there’s a certain region of the country that’s returning an item at a higher rate than everyone else. Was there a damaged truckload of product that was overlooked? Did the item not match the season?
Getting a handle on the geography of your returns can also help with disposition, including routing usable returns to regions that are buying up the product.
Where are the bottlenecks?
Drill down to which DCs and warehouses are meeting standards and which are slow to process returns. Quickly identify the bottlenecks so you can figure out root causes and keep product moving smoothly.
Ensure the errant customer isn’t causing bottlenecks either. BI data can report on which customers are purchasing and returning at abnormal rates, allowing you to enact policies that keep the number of their returns more reasonable.
Make returns intelligent, not a guessing game
Back-to-school and the holidays isn’t the time to be in the dark. With implementation times of just a few weeks, an RMS can give you near-immediate ROI with real-time insights and visibility across the entire returns journey.

Get a Demo
Discover how you can jump-start your returns management efforts with ReverseLogix.