E-commerce demand has jumped in the last few years, and product returns have risen with it. Many online retailers were not prepared, and returns now turn sales growth into losses. Returns data analysis shows where those losses come from.
Handling returns is costly, especially when you factor in shipping fees, restocking, and lost sales expenses. And there are many reasons why customers make these returns. It could be the wrong fit, a product that does not match its description, or buyer’s remorse. Whatever the case, you can reduce these returns, and it starts with the data. Returns data analysis exposes the reasons behind these returns and gives you insights into how to reduce them.
Challenges and Opportunities in Returns Data
With a compound annual growth rate (CAGR) of 18.9% from 2024 to 2030, the e-commerce industry’s market cap can reach $83.26 trillion by 2030. However, with an average of 20% returns, the returns process still has its fair share of challenges, such as:
- High return volumes
- Inefficient processing leading to delays and higher costs
- Negative impact on customer satisfaction and brand reputation
- Unclear reasons behind returns, making it difficult to address root causes
Returns data tells you about the product, customer behavior and operational efficiency. Analyzing ecommerce returns data helps you make decisions that reduce returns over time and lower their cost.
Types of Return Data
Return data helps businesses increase customer satisfaction and streamline inventory management. There are three types of return data.
1. Basic Return Data
This information is about the returned products and the customers who returned them. Basic return data contains information such as why a product is returned, the state of the return, when the return happened, and return merchandise authorization. For customers, it includes details such as who is returning the product, the reason for the return, their contact information, customer lifetime value, and their transaction history.
2. Advanced Return Data
Advanced return data covers the return process itself: customer experience, the last-mile return carrier, operational effectiveness and the infrastructure behind it. Businesses track customer feedback, carrier performance, operational efficiency, restocking efficiency and warehouse processing efficiency. This shows what is working and what is not, and where to improve the return process for customers.
3. Predictive Return Data
Predictive return data lets businesses forecast future returns with reasonable certainty, by analyzing what triggers returns and how to avoid or prepare for them. Businesses evaluate trends to identify patterns and understand the return behavior of different customer segments.
Key Data Points For Effective Returns Analysis
Returns data analysis involves collecting and interpreting information related to returned products. Your returns team needs the right data for the analysis to work. The wrong data set costs time and money and tells you little. Key data points include:
- Customer demographics and purchase history.
- Product details such as category, price, and features.
- Return channels, including online and in-store transactions.
- Common return reasons, categorized for better understanding.
- Timing of returns, particularly around promotions or seasonal trends.
What Returns Data Analysis Tells You
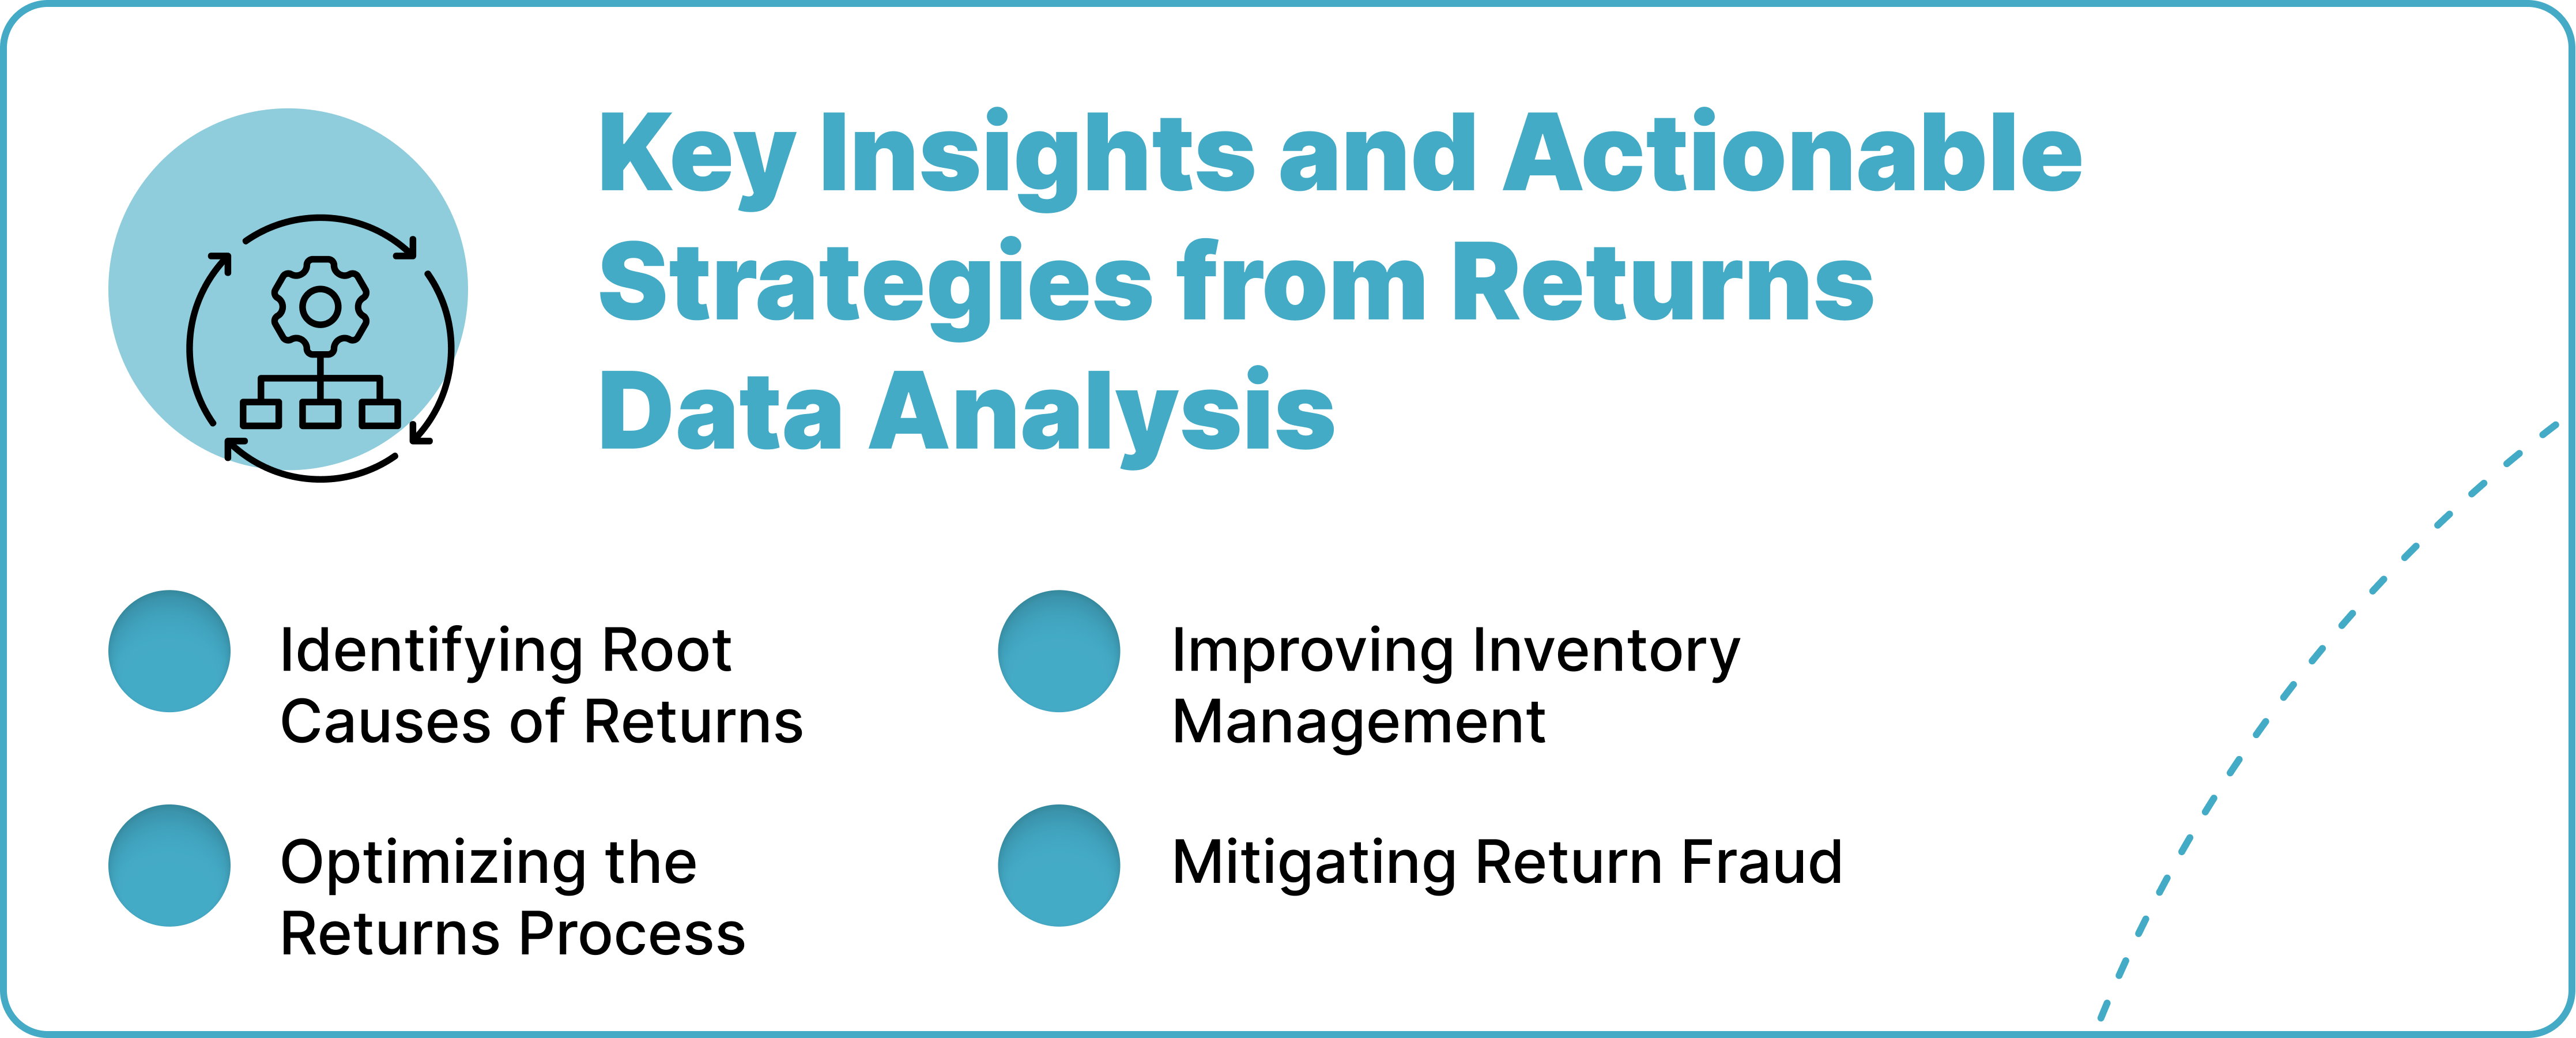
Returns data analysis lets you take a more precise approach to reducing returns. It helps in four areas:
1. Identifying Root Causes of Returns
Returns almost always have a reason behind them. Analyzing the return data uncovers patterns that point to recurring issues. Some of these include:
- Customer dissatisfaction due to misleading marketing.
- Frequent product defects or quality concerns (whether this is perceived or not)
- Inaccurate product descriptions or sizing charts that lead to mismatched expectations.
Once you know the causes, your supply chain and marketing teams can address them by refining product quality, improving descriptions, or setting better customer expectations through marketing.
2. Optimizing the Returns Process
Too many returns and inefficient returns are separate problems with different root causes. Returns data analysis shows where the process slows down, which lets you reduce costs and improve customer loyalty.
Ways to do this:
- Reducing the time taken to inspect, restock, or dispose of returned items
- Enhancing communication about return policies and processing timelines
- Simplifying return logistics, such as offering prepaid labels and pickup services
A hassle-free return process builds long-term customer relationships. It also takes personalized return policies, proactive customer support and follow-up alongside the faster process.
3. Improving Inventory Management
Returns data analysis gives you accurate information on returning inventory, which supports a stronger, data-driven forecasting system. This helps prevent stock imbalances caused by high return rates.
Use returns data analysis to:
- Adjust inventory replenishment based on return patterns.
- Optimize resale, refurbishment, or liquidation strategies to minimize losses.
- Identify products with excessive return rates and evaluate whether to discontinue or redesign them.
4. Mitigating Return Fraud
Certain return behaviors can indicate there is fraudulent activity in your returns management process. Returns data analytics helps you reduce it by:
- Detecting patterns of abuse, such as repeated returns from the same customer.
- Using AI-driven fraud detection tools to flag suspicious cases before processing returns.
- Finding and implementing measures like stricter return windows or return reason verification.
Implementing Returns Data Analysis: A Practical Approach
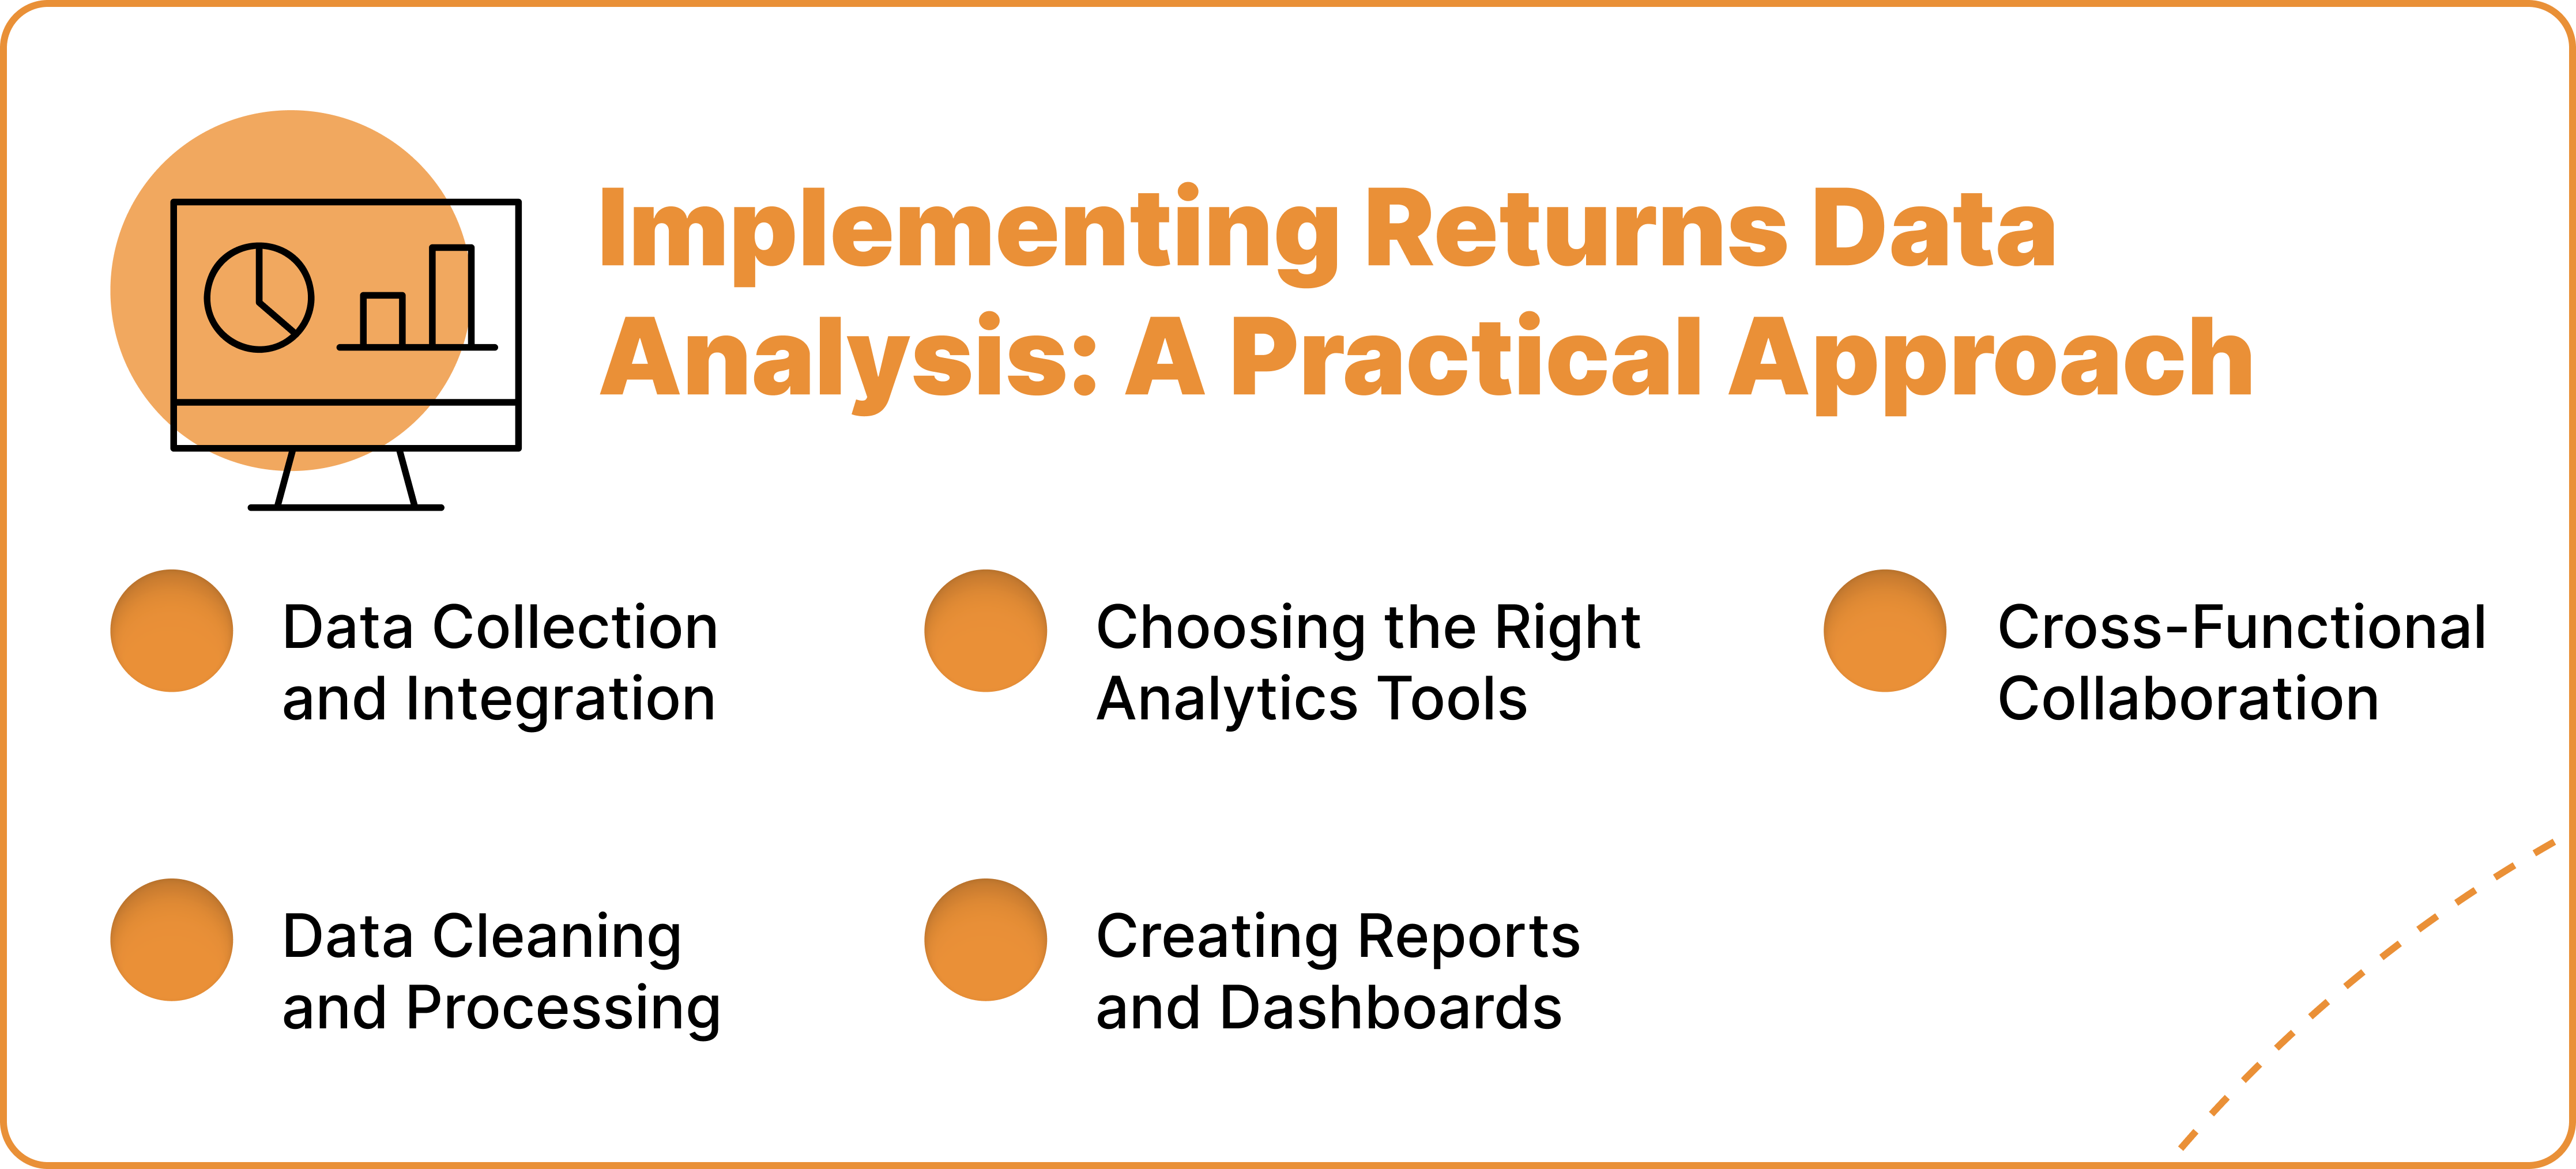
Getting value from returns data analysis takes five steps:
1. Data Collection and Integration
Successful analysis starts with gathering data from different sources, including:
- Warehouse and logistics tracking systems.
- Customer relationship management (CRM) tools.
- Point-of-sale systems and e-commerce platforms.
2. Data Cleaning and Processing
Standardizing return reasons and eliminating duplicate or incomplete records improves the accuracy of your returns analysis.
3. Choosing the Right Analytics Tools
You can use software solutions tailored for returns management, such as AI-driven analytics platforms or in-house data dashboards.
4. Creating Reports and Dashboards
Visualizing trends through dashboards helps your reverse logistics and returns teams spot issues quickly. These reports should track key metrics like return rates by product category, cost of returns, and reasons for returns.
5. Cross-Functional Collaboration
Returns data analysis should involve multiple teams, including:
- Marketing, to adjust messaging and manage expectations.
- Product development to improve design and quality.
- Operations to refine return logistics and reduce processing costs.
What is Business Intelligence?
Business intelligence (BI) is the strategies, practices, and knowledge you can develop by gathering and analyzing data and applying what you discover. BI helps you make better business decisions but, more importantly, it gives you the knowledge necessary to improve the performance of your business and, ultimately, improve the bottom line.
How Business Intelligence Is Used
Companies are increasingly seeing the benefits of incorporating business intelligence tools into their day-to-day operations, integrating historical data with projections and industry trends to determine the best course of action. The key is to have your BI integrated into a single platform so you can use both aspects, historical information and future trends, in the same place.
Many companies also want managers to access information without constant IT involvement. Self-service business intelligence gives decision makers that access without the technical skills that used to be required. The ability to slice and dice data, analyze with visualization tables, and find statistical analysis in a returns management system with a user-friendly interface is essential.
How to Improve Your Reverse Logistics Business Intelligence
Improving BI in reverse logistics comes down to three practices:
Use Real-Time Data Analysis
Real-time data analysis is crucial in reverse logistics. With BI tools that provide real-time insights, businesses can respond immediately to logistics challenges and customer returns. This capability allows for quicker decision-making and more efficient management of the reverse logistics chain.
Real-time data helps in monitoring return rates, customer satisfaction levels, and the performance of logistics partners. This immediate feedback loop enables companies to address issues quickly and stop small problems from growing.
Visualize Logistics Data & Create Custom Reports
Data visualization and custom reports turn complex data sets into something teams can read and act on. By visualizing logistics data, stakeholders can quickly grasp patterns, trends, and anomalies.
Custom reports tailored to the specific needs of the business allow for a deeper understanding of various aspects of reverse logistics. These reports can focus on areas like return reasons, time-to-resolution, and customer feedback trends. The ability to customize these reports means that different departments or teams can have access to the information most relevant to their operations.
Forecast Trends with Predictive Analytics
Predictive analytics is a forward-looking aspect of BI that uses historical data to forecast future trends. In reverse logistics, predictive analytics helps businesses anticipate and prepare for future challenges and opportunities.
By analyzing past return patterns, customer behavior, and market trends, predictive analytics can forecast future return volumes, potential logistic bottlenecks, and customer service needs. This foresight allows businesses to proactively adjust their strategies, allocate resources more effectively, and stay ahead of market dynamics.
Returns Data Analysis With ReverseLogix
ReverseLogix builds metrics and reporting into every module. It offers end-to-end returns management with tracking and data analytics. The platform connects to your existing business systems and delivers metrics and data to every team member.
Gain visibility across the entire customer returns journey, with diagnostic and descriptive analytics, less waste, a better customer experience and detailed customer feedback from a real-time platform. Request a demo.
Frequently Asked Questions
1. What makes data analysis important or critical in returns management operations?
Analyzing returns data helps businesses understand patterns in return behavior, predict future return volumes, and identify common reasons for returns. With this information, they can create strategies that reduce the frequency of returns, improve operational efficiency, and enhance customer satisfaction
2. How can ecommerce platforms use data analytics to identify trends in returns?
By collecting data management and examining them on product categories, customer demographics, and timing, businesses can spot recurring issues, such as defects in specific products or seasonal surges in returns.
3. What are the benefits of using predictive analytics in managing returns and reverse logistics system?
Predictive analytics, combined with statistical analysis of the entire returns process, can forecast return rates, allowing businesses to prepare inventory and staffing levels accordingly. This reduces delays, improve customer satisfaction, enhances resource allocation, and minimizes costs..
Get a Demo
Discover how you can jump-start your returns management efforts with ReverseLogix.