Which Returns Metrics Should We Track?

Returns management is now a standard part of supply chain management, especially for e-commerce platforms. Reverse logistics refers to the process of moving products from their final destination back to the seller or manufacturer for return, repair, refurbishment, or recycling.
Forward logistics gets products to customers. Reverse logistics brings them back when the customer is not satisfied. Managing these returns is a core part of e-commerce operations, and it is hard to do without the right returns metrics.
Returns metrics show where the problems are. Monitoring them improves decisions, resource use and cost control. Because the reverse supply chain involves the customer more directly than the forward one, good use of returns metrics also improves satisfaction and loyalty.
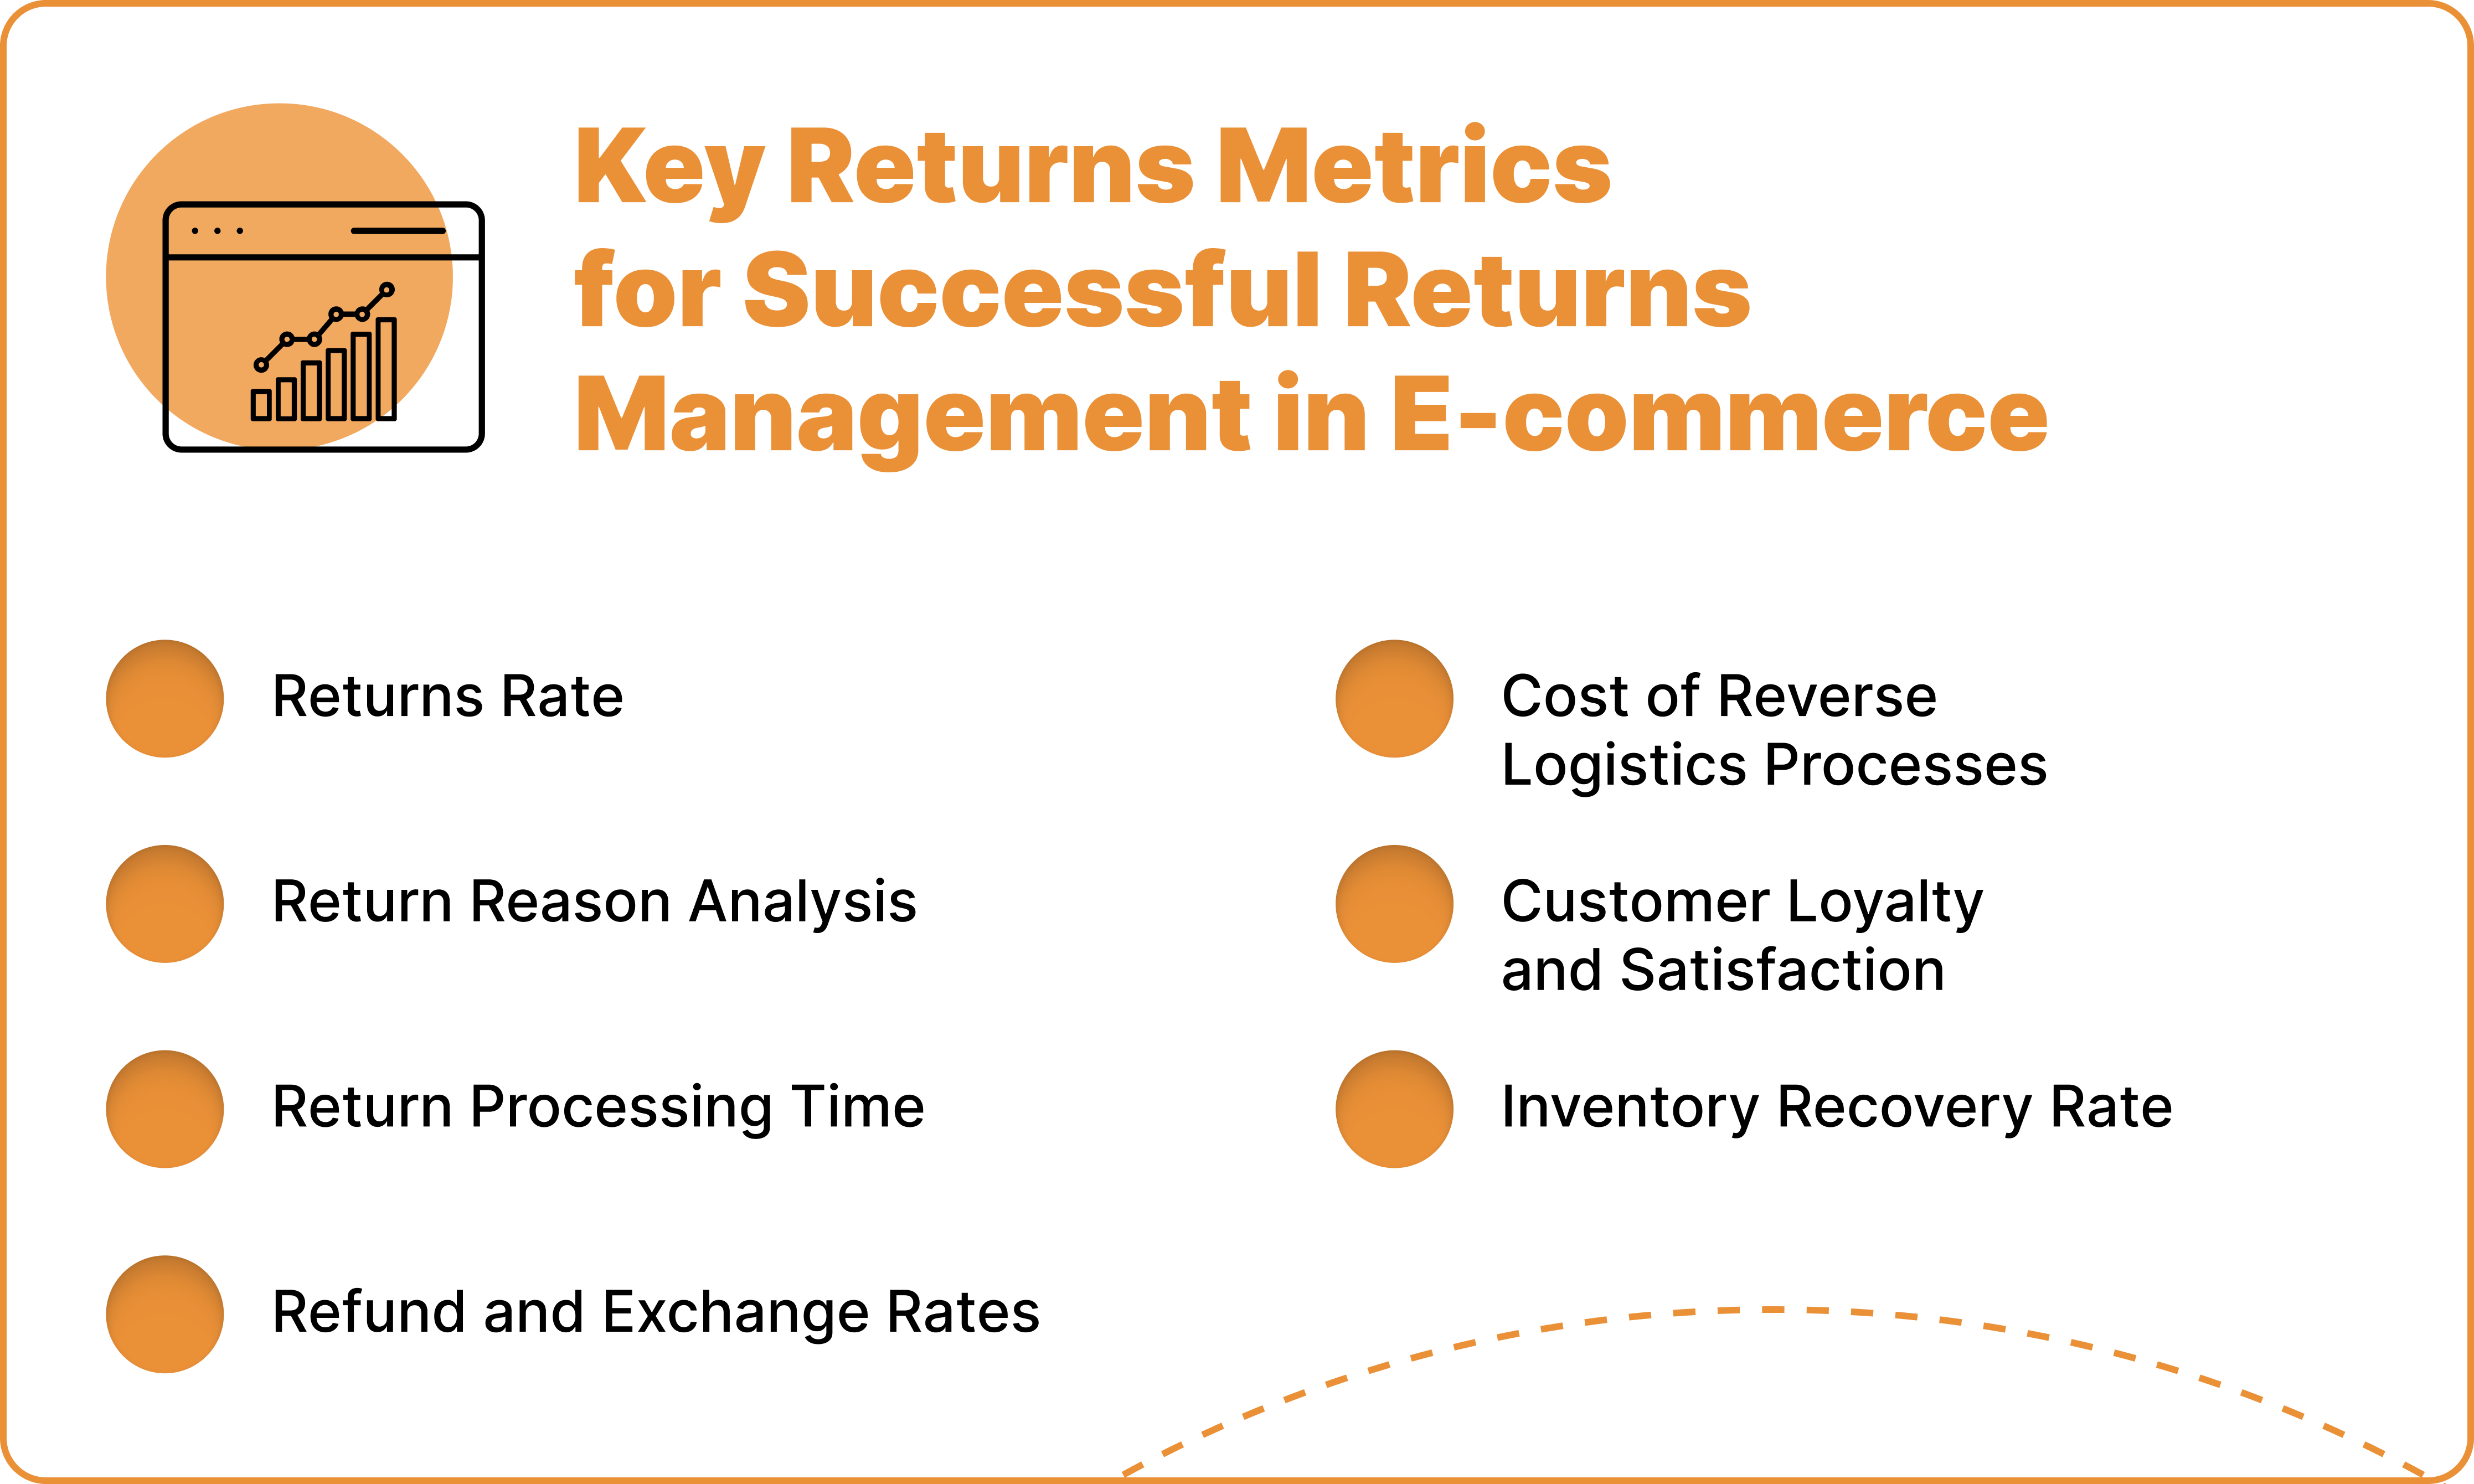
1. Returns Rate
Monitoring the returns rate shows how often a product comes back, as a percentage of total orders for that product. With this, e-commerce businesses can make better decisions about stocking that specific product/SKU in the future.
A low return rate means the business is getting the product fit, description and delivery right, and customers are satisfied. A high return rate means either a problem with the product or mistakes in delivery, and it should prompt an investigation into the cause.
A clear return policy can significantly impact return rates by setting customer expectations and reducing misunderstandings.
Regularly tracking return rates across product categories can help e-commerce businesses uncover patterns that need attention. Addressing return causes can reduce future return rates, cut costs, and improve customer satisfaction.
2. Return Reason Analysis
Returns happen for various reasons. They could be due to the wrong size, fit, delivery, or description. This metric identifies the reasons behind returns and shows what to change to reduce them.
For example, if customers return an item because it is the wrong size, investigate why. Is the description wrong, or do customers not understand it? Sometimes, it could also be because they do not trust the sizes described, so they buy various sizes to get the right fit and then return the rest.
Customer feedback explains why customers return items. It lets companies address common problems, like refining product descriptions, improving size accuracy, or enhancing packaging quality. This way, e-commerce companies can make improvements that reduce return volume and raise customer satisfaction.
3. Return Processing Time
Customers want deliveries fast, and they want returns processed even faster. Return processing time is the average time it takes to process a return from receipt to completion (refund or exchange).
The faster the e-commerce platform processes returns, the more product returns it can handle and sort out quickly. It also settles disputes and customer queries faster, which improves satisfaction and loyalty. A long return cycle causes dissatisfaction and hurts cash flow.
Tracking this metric shows where the bottlenecks are in the returns process, so you can fix them.
4. Refund and Exchange Rates
Some returns are outside the business’s control. For example, holiday sales come with high return rates because people return gifts they do not want. The sale has already been made, so whether the return ends in a refund or an exchange affects profit.
This metric tracks the percentage of returns that result in a refund or product exchange. Exchanges are better, and a high refund rate compared with the exchange rate can indicate a lack of customer confidence in product replacement options.
Analyzing this metric shows what customers prefer and informs ways to promote exchanges over refunds, which reduces revenue loss. Offering store credit is one way to encourage exchanges.
A customer retention strategy also helps: customers who trust the business are more likely to exchange than refund.
5. Cost of Reverse Logistics Processes
Customers pay for shipping when they buy, but most online retailers do not charge for returns, especially when the return is not the customer’s fault.
Whoever pays, reverse logistics costs are real. They include transportation, handling and restocking, and they use the same processes and resources as forward logistics, at lower volume.
Tracking this metric is the basis for managing and reducing the cost of returns.
6. Customer Loyalty and Satisfaction
A poor return experience drives customers away, and a good one improves retention, so collect feedback on the returns experience. Positive experiences build confidence and repeat purchases. Tracking satisfaction through the returns process shows how well it meets customers’ needs.
A customer feedback loop keeps the returns process improving: gather feedback, analyze it and adjust.
7. Inventory Recovery Rate
This metric is the percentage of returned items that can be resold or refurbished. Take, for example, electronics. A higher recovery rate minimizes financial loss by increasing the resale potential of returned items. Inventory management matters when managing ecommerce returns, and tracking recovery rates lets you identify which product categories are most viable for resale and improve inspection processes to maximize recovery.
By understanding the resale value of returned items, businesses can better assess the financial benefits of recovering and reselling these products.
Which Reverse Logistics Metrics Should I Measure?
When numbers come in from everywhere, it is hard to know which ones give the most useful information about your reverse logistics.
At a minimum, RMS users should be able to view every module, queue and order. Every screen should offer the data and BI you need. Reporting should be automated when possible and customizable when needed, so you get immediate insight to make sure your goals are on track and that you’re catching potential problems early.
Based on our diverse customers’ use and feedback about ReverseLogix BI, we’ve gathered the top metrics that retailers, 3PLs, manufacturers and eCommerce companies should be tracking to improve processes, reach sustainability goals, and improve productivity and cost.
Key Metrics for Process Improvements
- Average time to process RMAs/average time by RMA task: Discover exactly how long it takes to process a return, task by task. Track the item the moment it leaves a customer’s hand until the final step (exchange, resale, RTV, recycling, repair or disposal), and get visibility into areas that are lagging behind or ways to improve efficiency.
- Per-item handling costs:What is the total cost to process returned items, taking into account facility costs, labor costs, shipping costs, etc.? If you have multiple facilities that process returns, this can be a comparison tool to eliminate bottlenecks and automate parts of the process that don’t need a human touch point.
- Disposition cycle time: How quickly can you get products from the return stage to the proper disposition (resale, recycling, return to vendor, or disposal)? Track this metric separately for items that can be resold, returned to vendor, recycled, or thrown away so you can figure out how long each one takes.
Key Metrics for Sustainability Initiatives
- Recycled product vs waste: How much of the material that cannot be resold is recycled appropriately? How much of it must be thrown away? These are important metrics for sustainability efforts that prioritize reselling or recycling rather than landfilling.
- Returned merchandise resale percentage: Like the recycling versus waste metric above, this reveals how much of your returned product can be resold, which is important both for recuperating costs and for sustainability goals. You’ll also be able to see how much of the initial sales price you could recapture.
- Distance traveled per returned item: Consumers love online shopping, but the back-and-forth delivery eats up packaging materials and increases delivery vehicle emissions. Know how far a product has to travel in the course of a returns process. Distance traveled can be broken down by disposition type, such as resale, recycling, return to vendor, and landfill waste.
Key Metrics for Productivity and Cost
- Total product costs:You’re likely already tracking the cost of goods sold, but in order to get a true sense of the cost to your business you need to have a “total cost of ownership” metric that includes COGS, initial shipping, returns processing, return shipping, and disposition costs minus any money you can get for resale or disposal (such as RTV).
- RMAs by channel: ReverseLogix is one of the few returns management systems that serve B2C, B2B and hybrid environments. Track returns from retail, eCommerce, wholesale, and more to gain better visibility into costs, speed and productivity by channel.
- Returned items inventory: Which items are being returned and at what rates? Uncover the items that are more likely to be returned and common reason codes, so you can pinpoint root causes that can be addressed and make processing the return more efficient.
ReverseLogix returns management technology tracks reverse logistics, provides you with the metrics and insights you need, and automates processes to make it easier for your team to improve returns for your customers and your business.
Measure the Financial Impact of Reverse Logistics
Beyond just the total cost of returns, which is an important metric, there are other things you should be tracking to identify the root cause of returns, disposition methods, and more. Also track:
- Total product reclaimed and resold: reselling items that are returned, even if it’s done at a discount, offers an opportunity to make some money and recoup some or all of the COGS. To get a sense of how much of your product can be resold, track this metric.
- Value from resale: in addition to the metric above, also track the value of the products that you can resell. Determine if you are making back at least your costs, plus any added profit.
- Waste, energy, and recycling metrics: if your company is looking at sustainability efforts, tracking these three metrics is essential. Identify how much of your product can be recycled, how much is sent to landfills or incinerated, how far each product must travel in the returns process, and how much energy is consumed in returns.
Knowing this information can help you improve your product offerings, create better online listings, choose higher quality vendors (if you experience a high volume of returns for errors), or improve the returns process.
Tracking Key Returns Metrics With ReverseLogix
ReverseLogix builds metrics and reporting into every module. With end-to-end returns management, tracking and analytics, it connects your existing business systems and delivers metrics and data to every team member.
Gain visibility across the entire returns journey. Use data analytics to track key returns metrics, and access customized reporting by department, user role or location so distributed teams stay in sync. Request a demo.
Frequently Asked Questions
Q1. How does the cost of the reverse logistics system influence the returns management process?
Reverse logistics costs cover expenses associated with transportation, handling, and restocking returned products. This is why every e-commerce brand must have a solid reverse logistics plan. It can help identify inefficiencies and opportunities for reducing expenses in the returns process. Additionally, effective customer service plays a crucial role in managing returns, ensuring a smooth and satisfactory experience for customers.
Q2. What role does packaging play in reducing return rates?
Proper packaging protects items during shipping, reducing the chance of damage, a common reason for returns. Environmentally friendly packaging also aligns with customer preferences and may improve satisfaction.
Q3. How does tracking return rate by product category provide actionable insights?
Analyzing return rates by category helps pinpoint specific products or types of goods with high customer returns, allowing businesses to effectively address quality, fit, or description issues in specific categories.
Get a Demo
Discover how you can jump-start your returns management efforts with ReverseLogix.